Glut of New Houses in the South is Bigger than During the Housing Bust

Glut of New Houses in the South is Bigger than During the Housing Bust

By Wolf Richter for WOLF STREET.

Yesterday, we looked at the surge of new completed “spec” houses for sale, and at the surge of new houses for sale at all stages of construction, for the US overall. Now we’ll look at at new houses for sale in the four regions of the US.

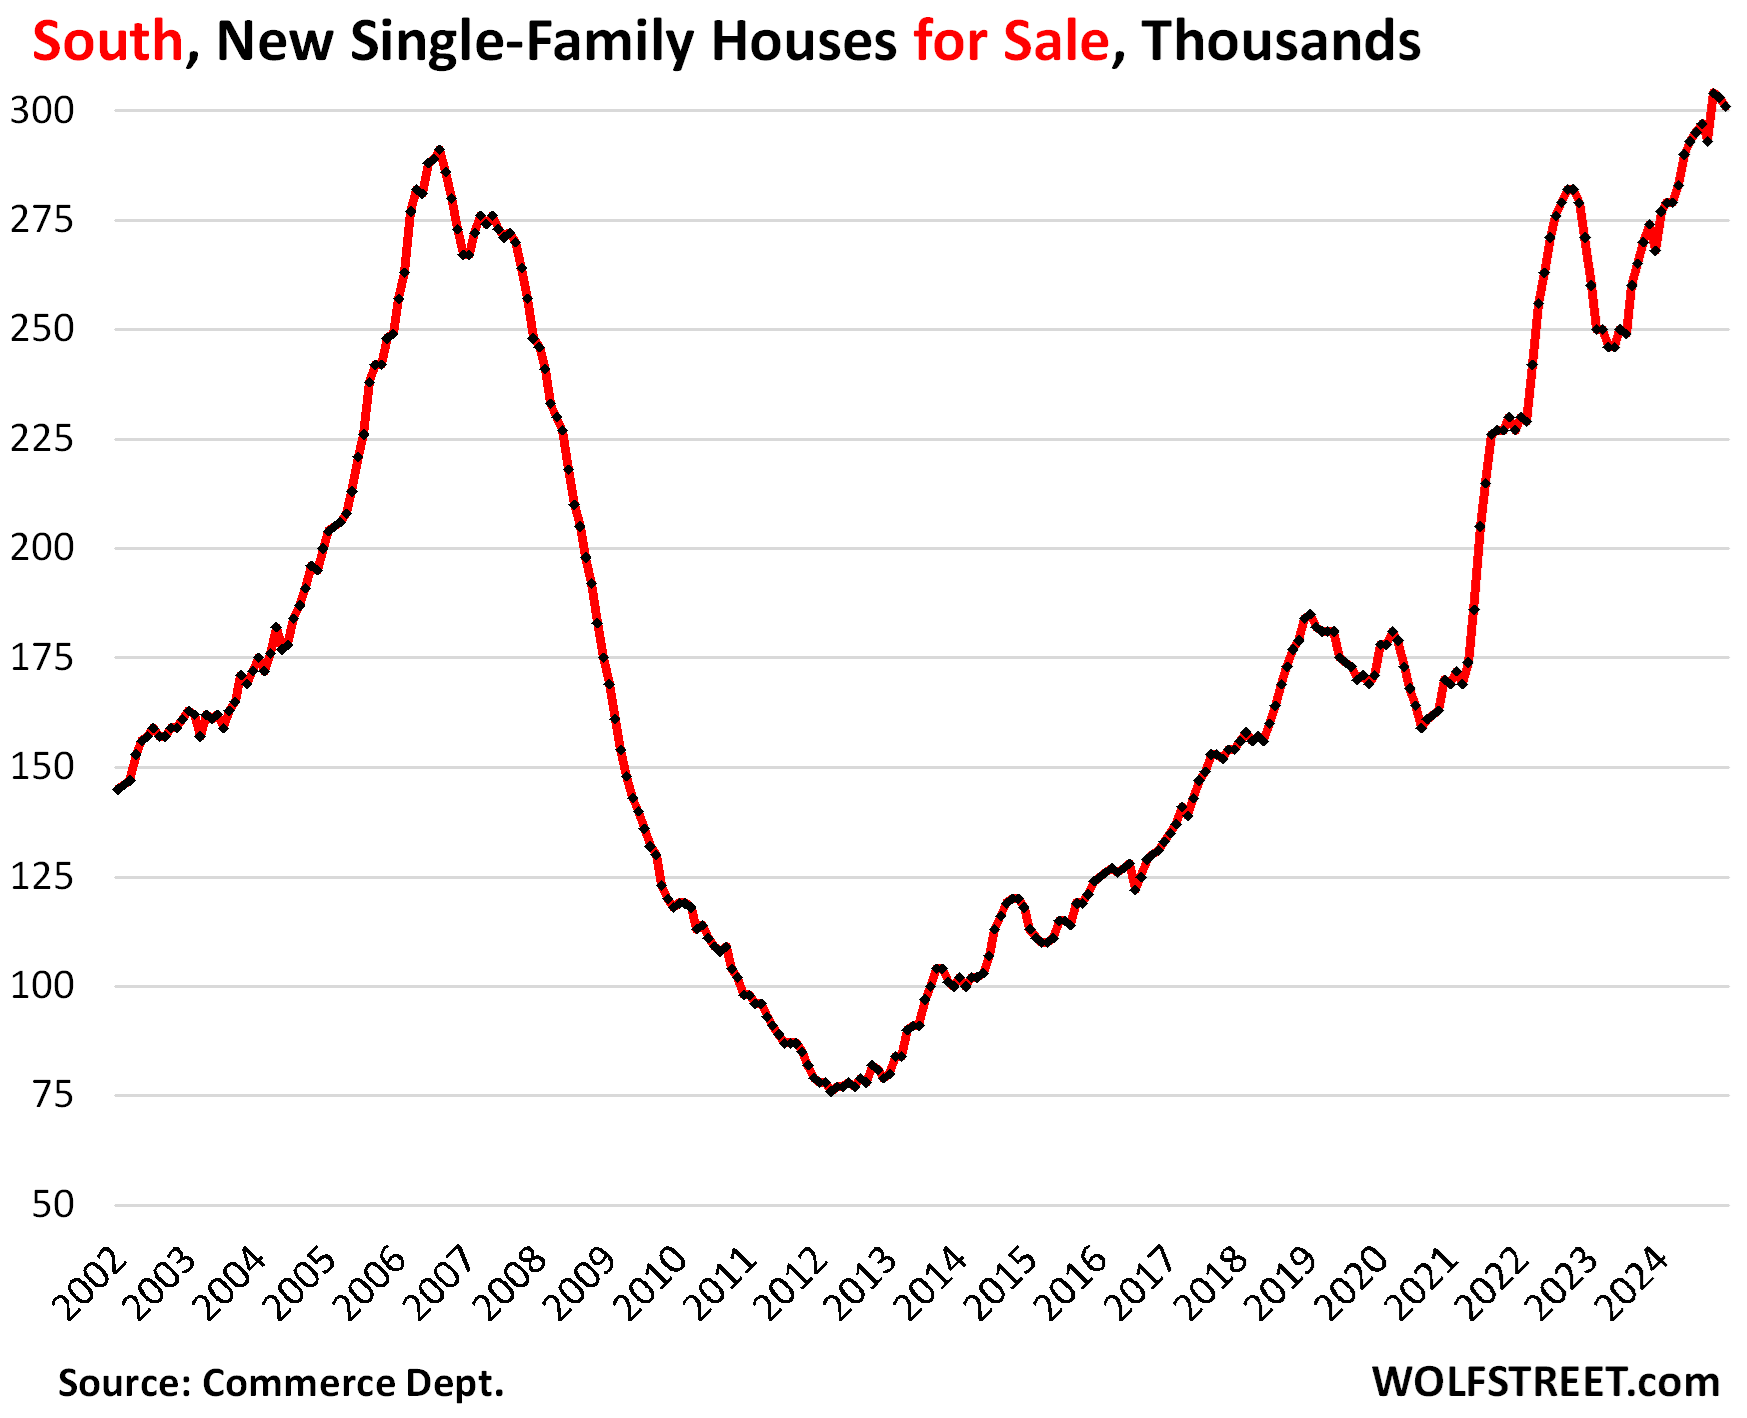
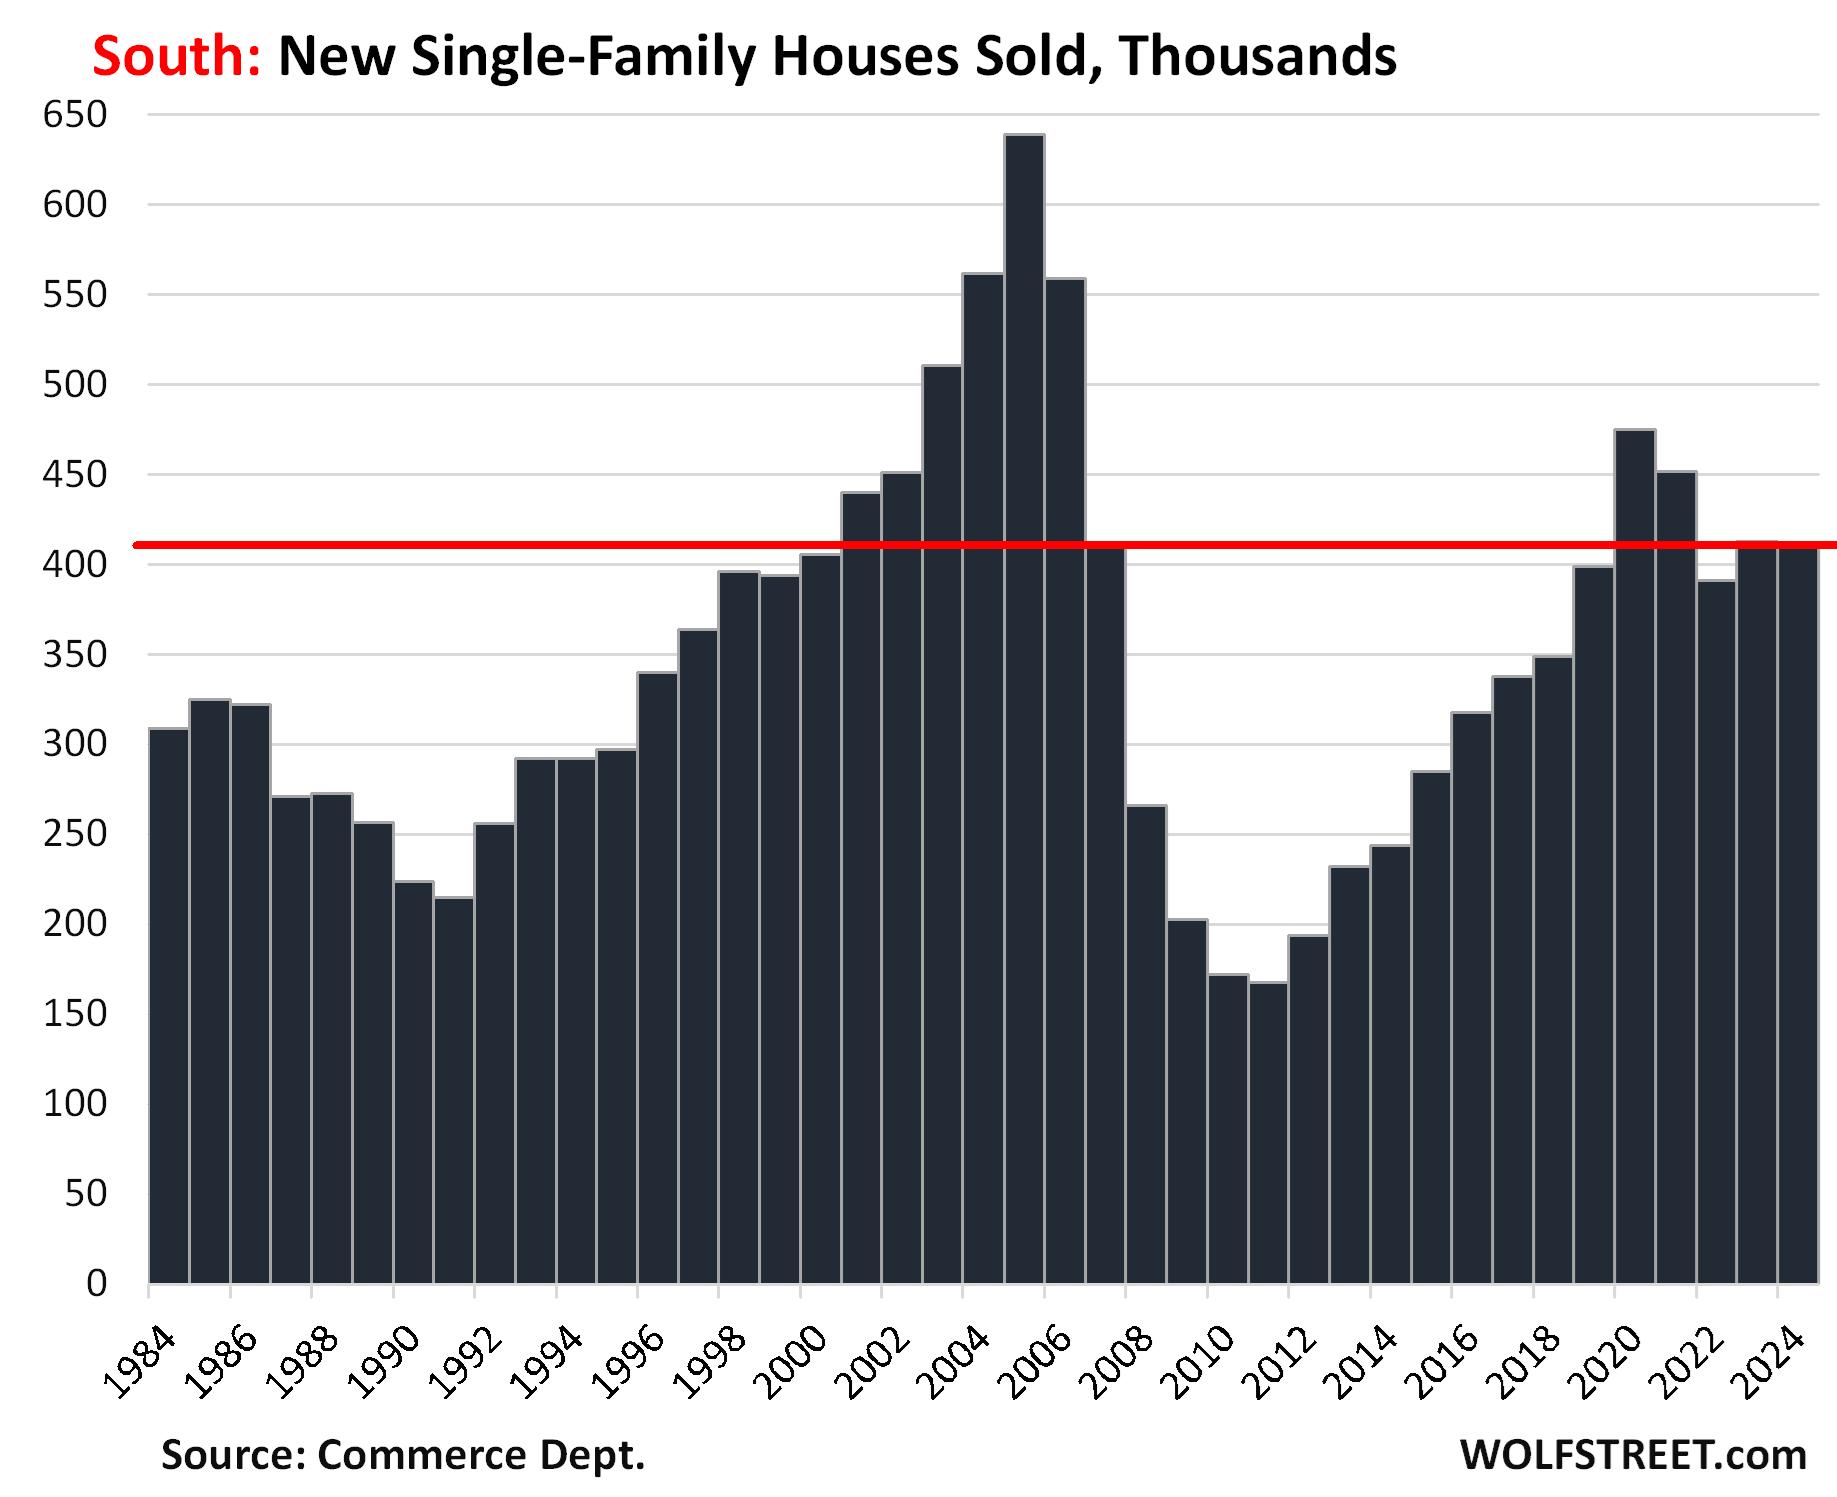
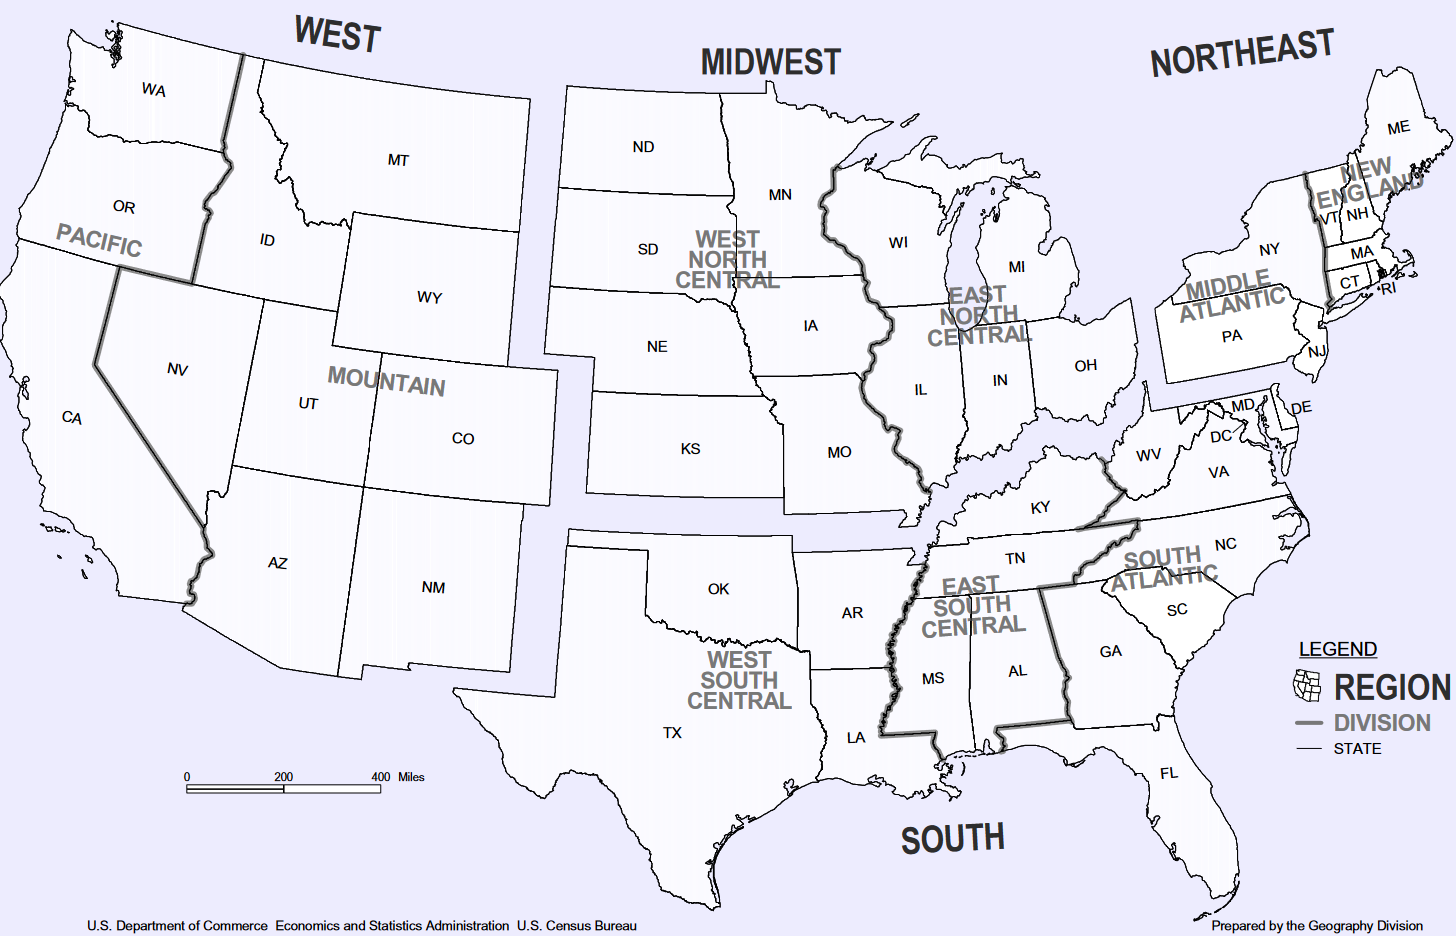
In the South – the largest region, with a population of 133 million, see map below – has the most inventory of new houses ever, surpassing even the astronomical levels on the eve of the Housing Bust, just before it all fell apart.

Since June 2024, new houses for sale in the South have surpassed the high of August 2006. In June, there were 293,000 new houses for sale (compared to 291,000 in August 2006). Since then, the inventory of new houses for sale has further ballooned and in October reached 304,000, and has remained in that range through December (301,000). Since December 2019, inventory has exploded by 76%. This is a massive amount of inventory of new houses for sale.

But sales of new houses in the South in 2024 edged down a hair from the prior year, to 411,000 houses sold, and was down by 13% from 2020 and by 9% from 2021, but was up by 3% from 2019.

Those sales were reasonably decent, thanks to the large-scale incentives, including mortgage-rate buydowns that homebuilders have been using to stimulate demand.

So it’s not that sales have collapsed like sales of existing homes – they haven’t – but that sales lagged far behind the speed with which homebuilders put inventory on the market over the past several years, and now there’s this glut of houses for sale.

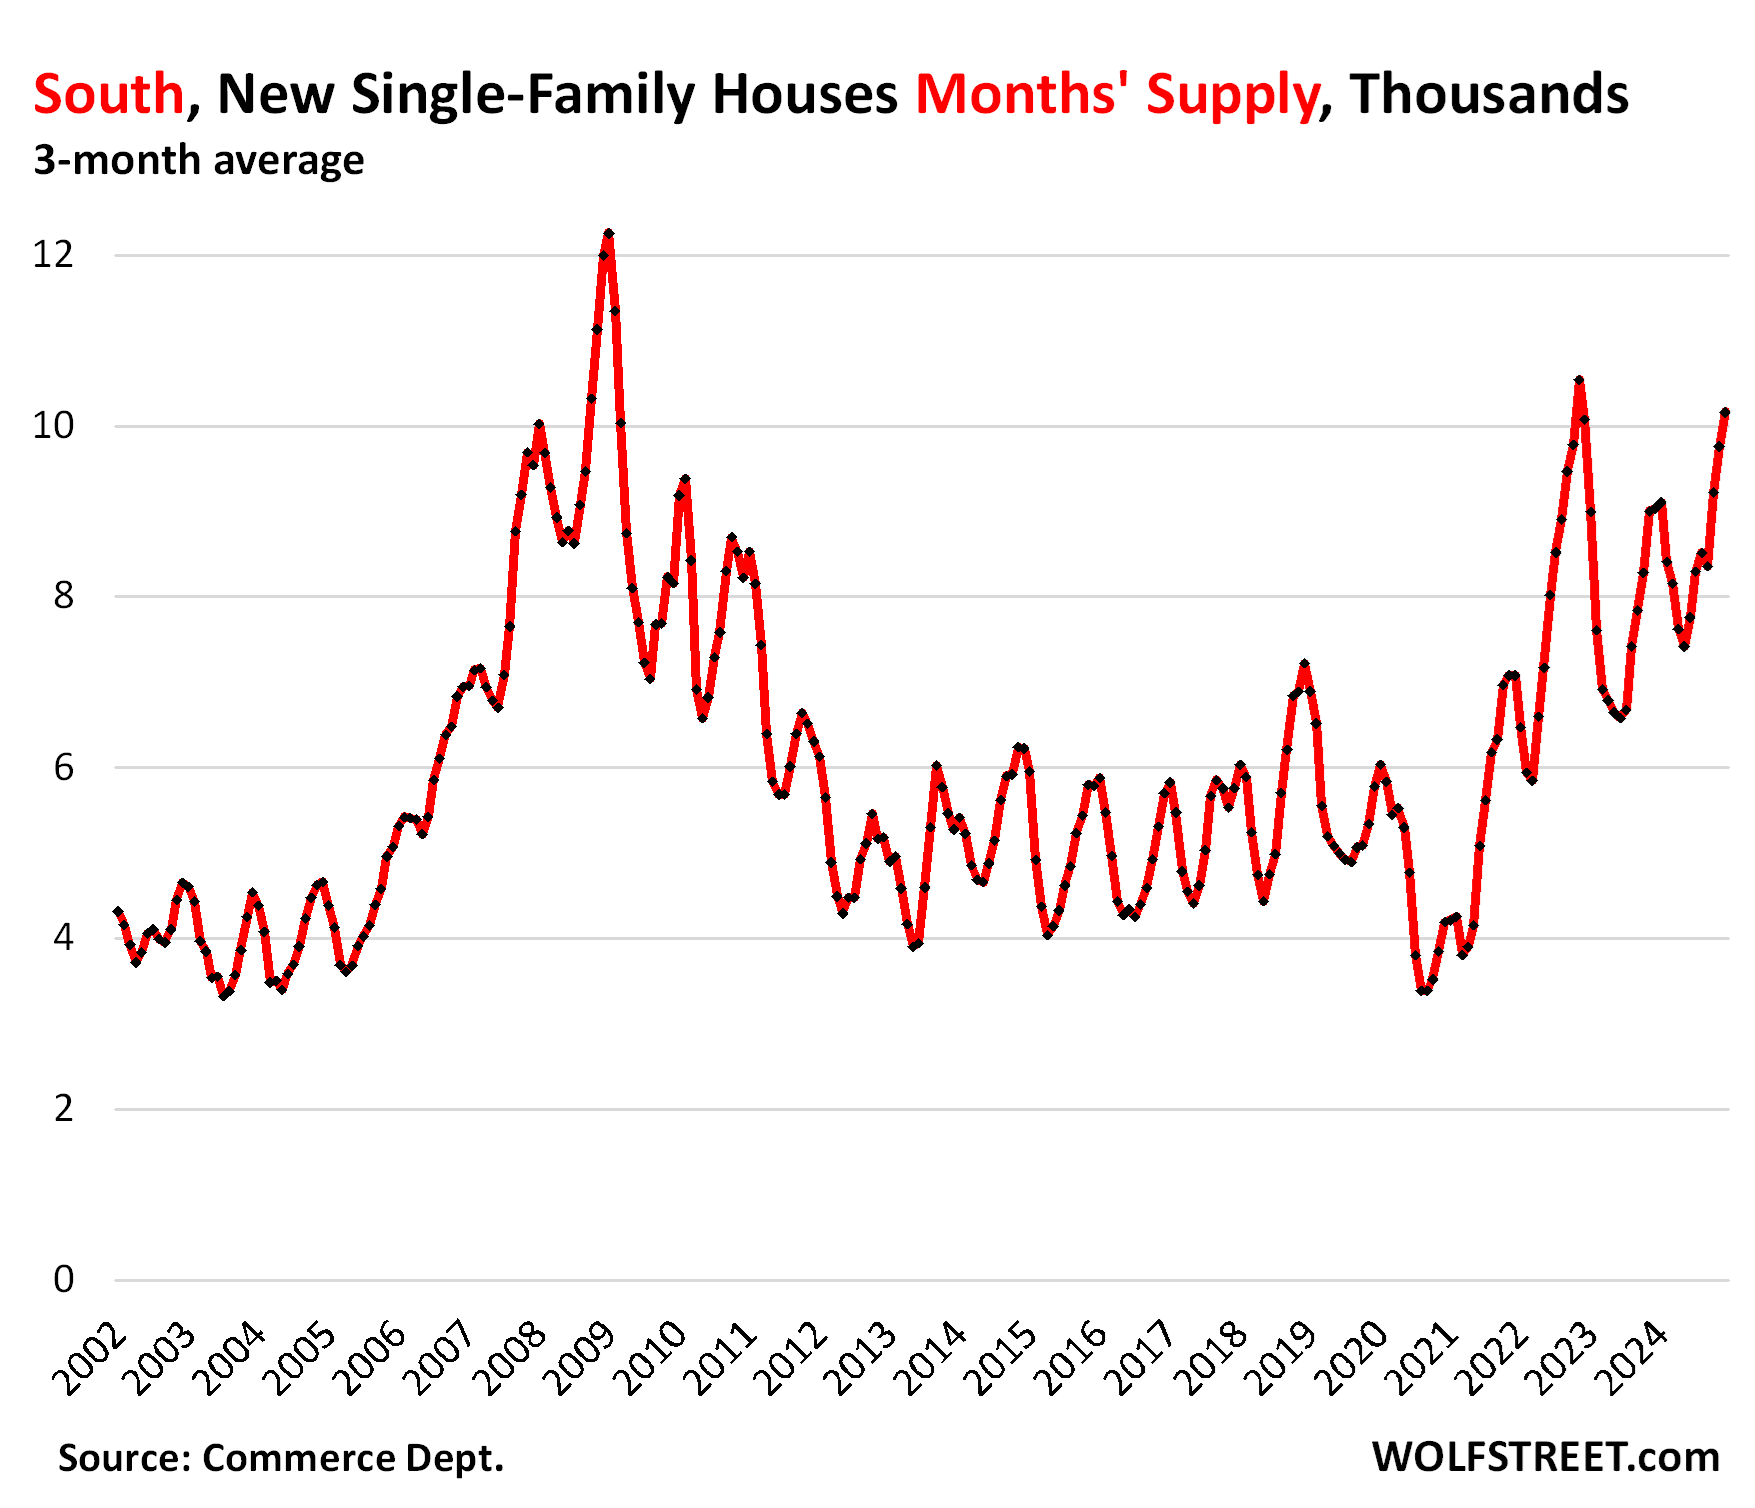
So supply of new houses for sale, at the current rate of sales, has pierced the 10-month range. To iron out some of the big monthly squiggles, we look at the three-month average. Seasonally, the peak supply period is in November through January in this three-month average. Beyond seasonality, the trend is clear, with supply having about doubled from the pre-pandemic range:

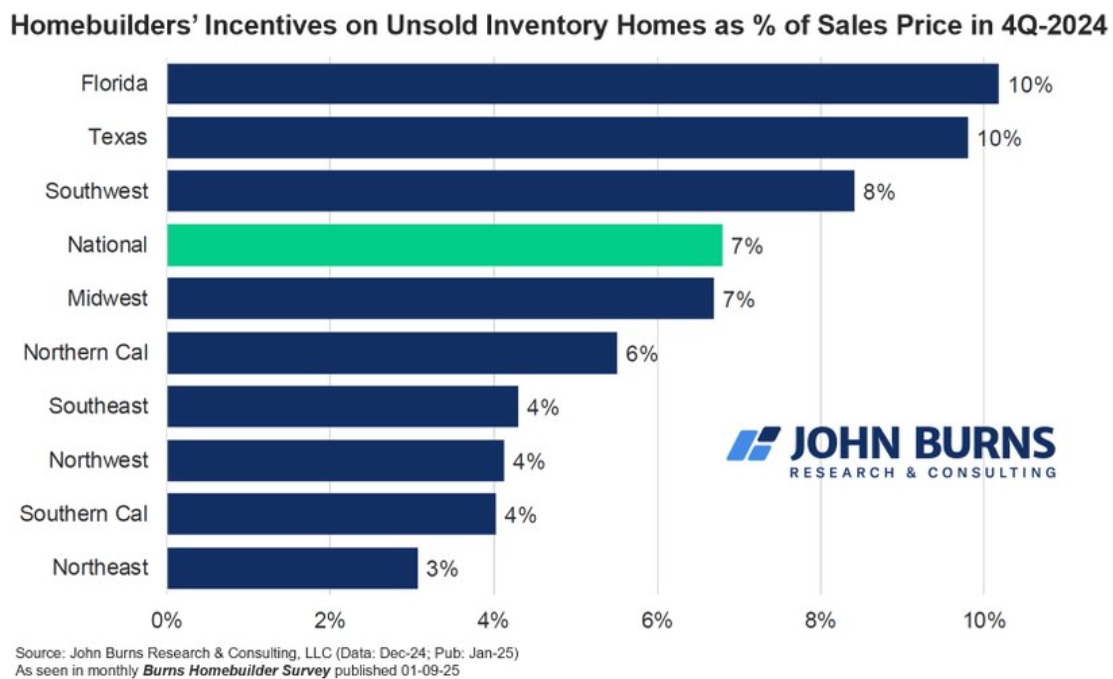
Homebuilders offered incentives amounting to 10% of the sales price on average in Texas and Florida to get the inventory moving, according to the most recent Burns Homebuilder Survey. And that’s clearly not enough to get the inventory moving.

Here is a map of the four Census regions:
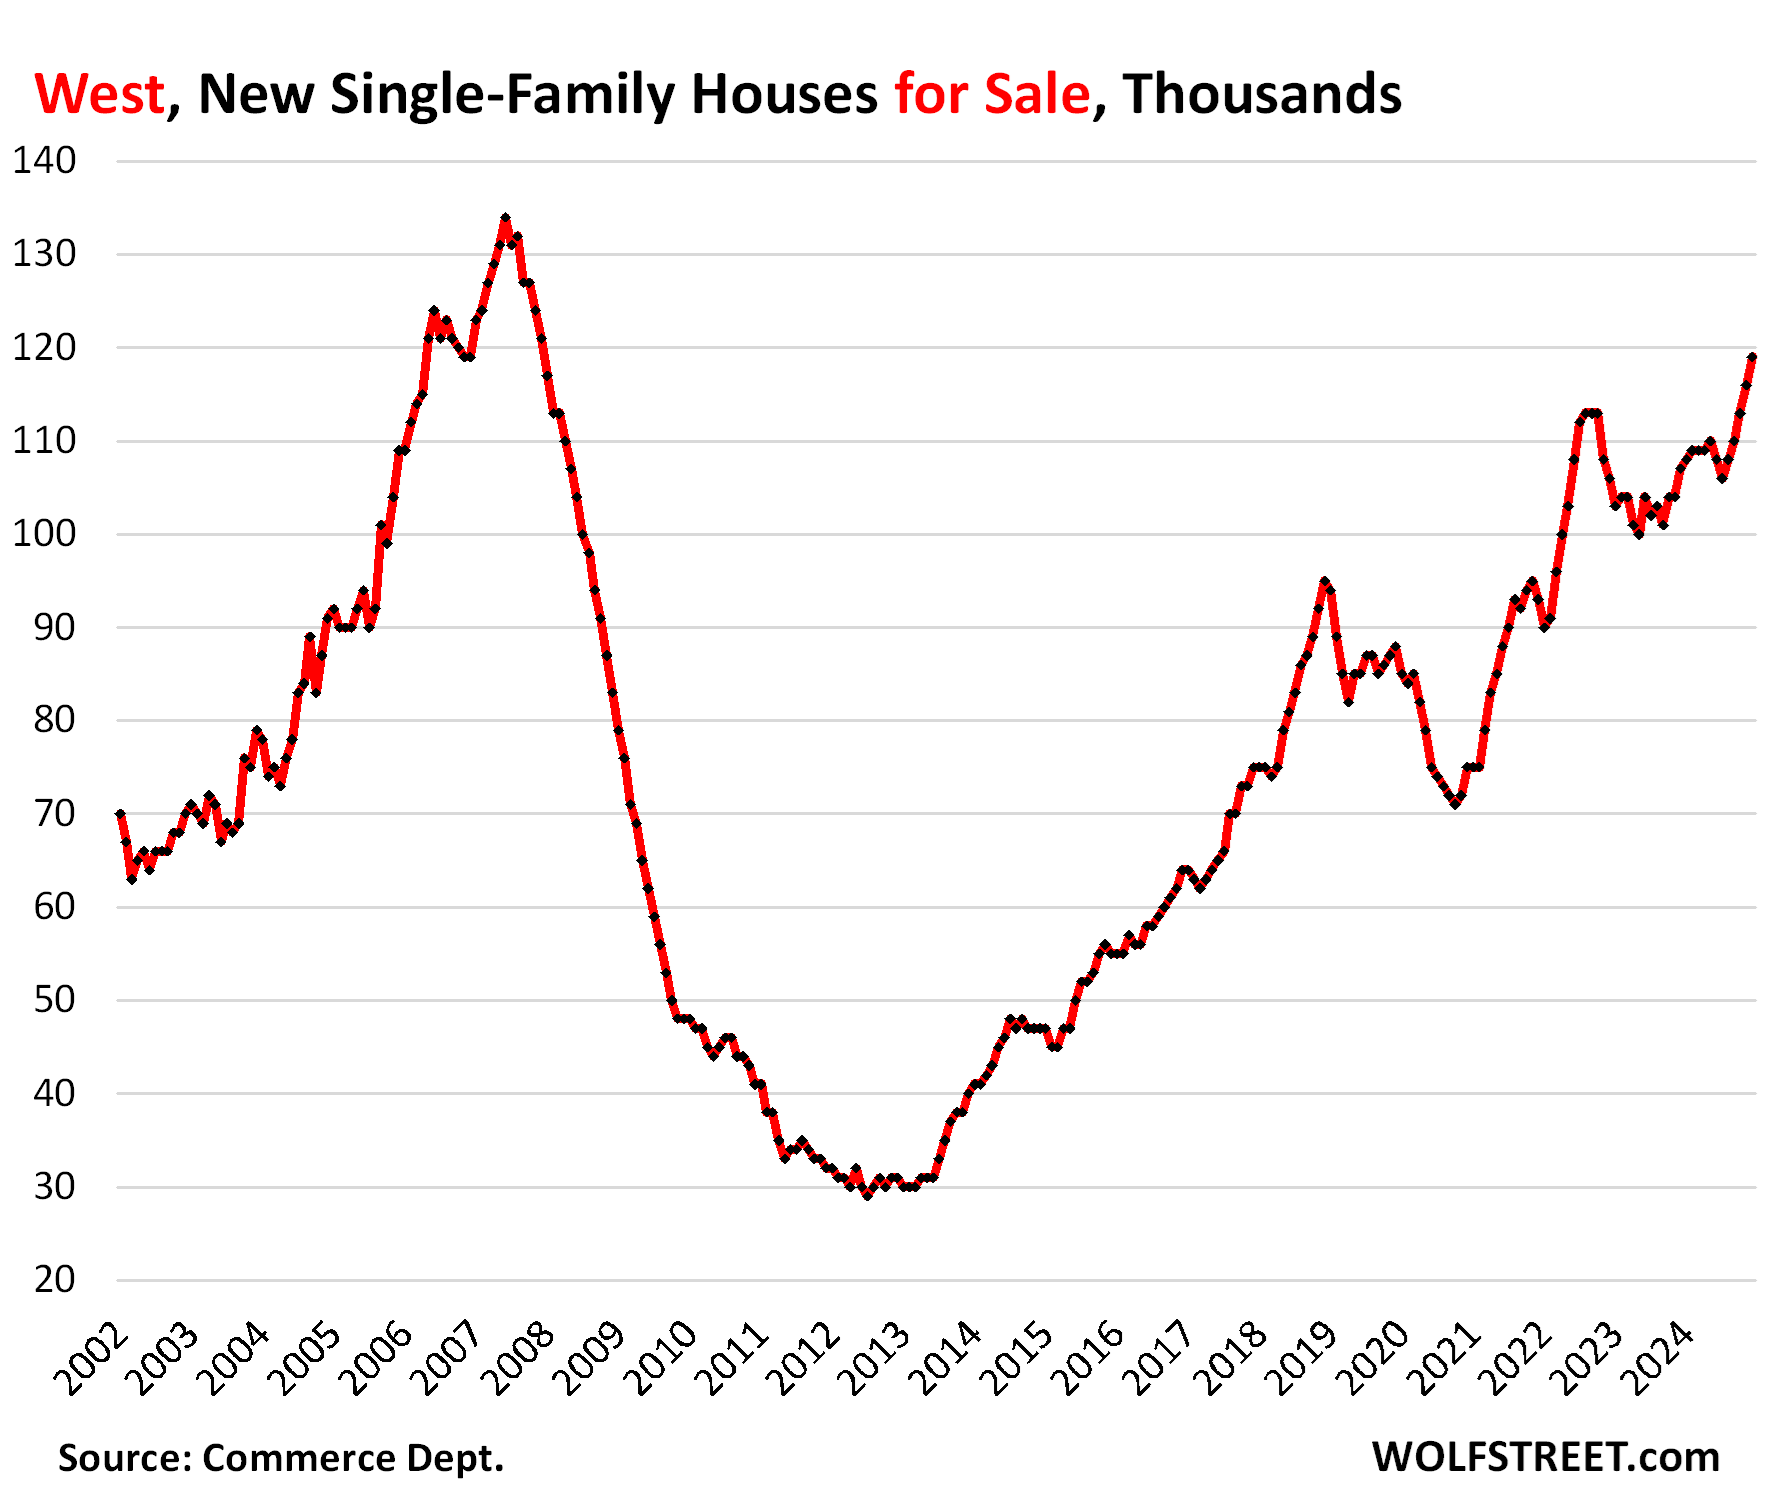
The West.

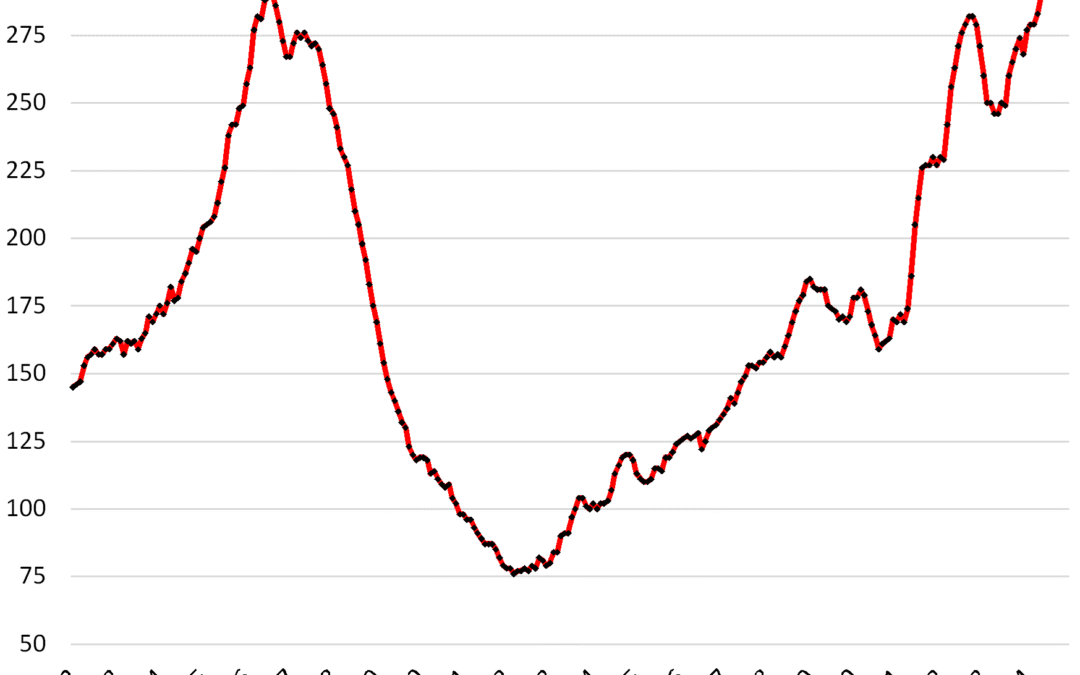
In the West – the second largest Census region, with a population of 80 million – a similar problem is piling up. Inventory of new houses for sale surged to 119,000, the highest inventory since December 2007, not far below the peak in June 2007 early on in the Housing Bust, and up by 35% from 2019:

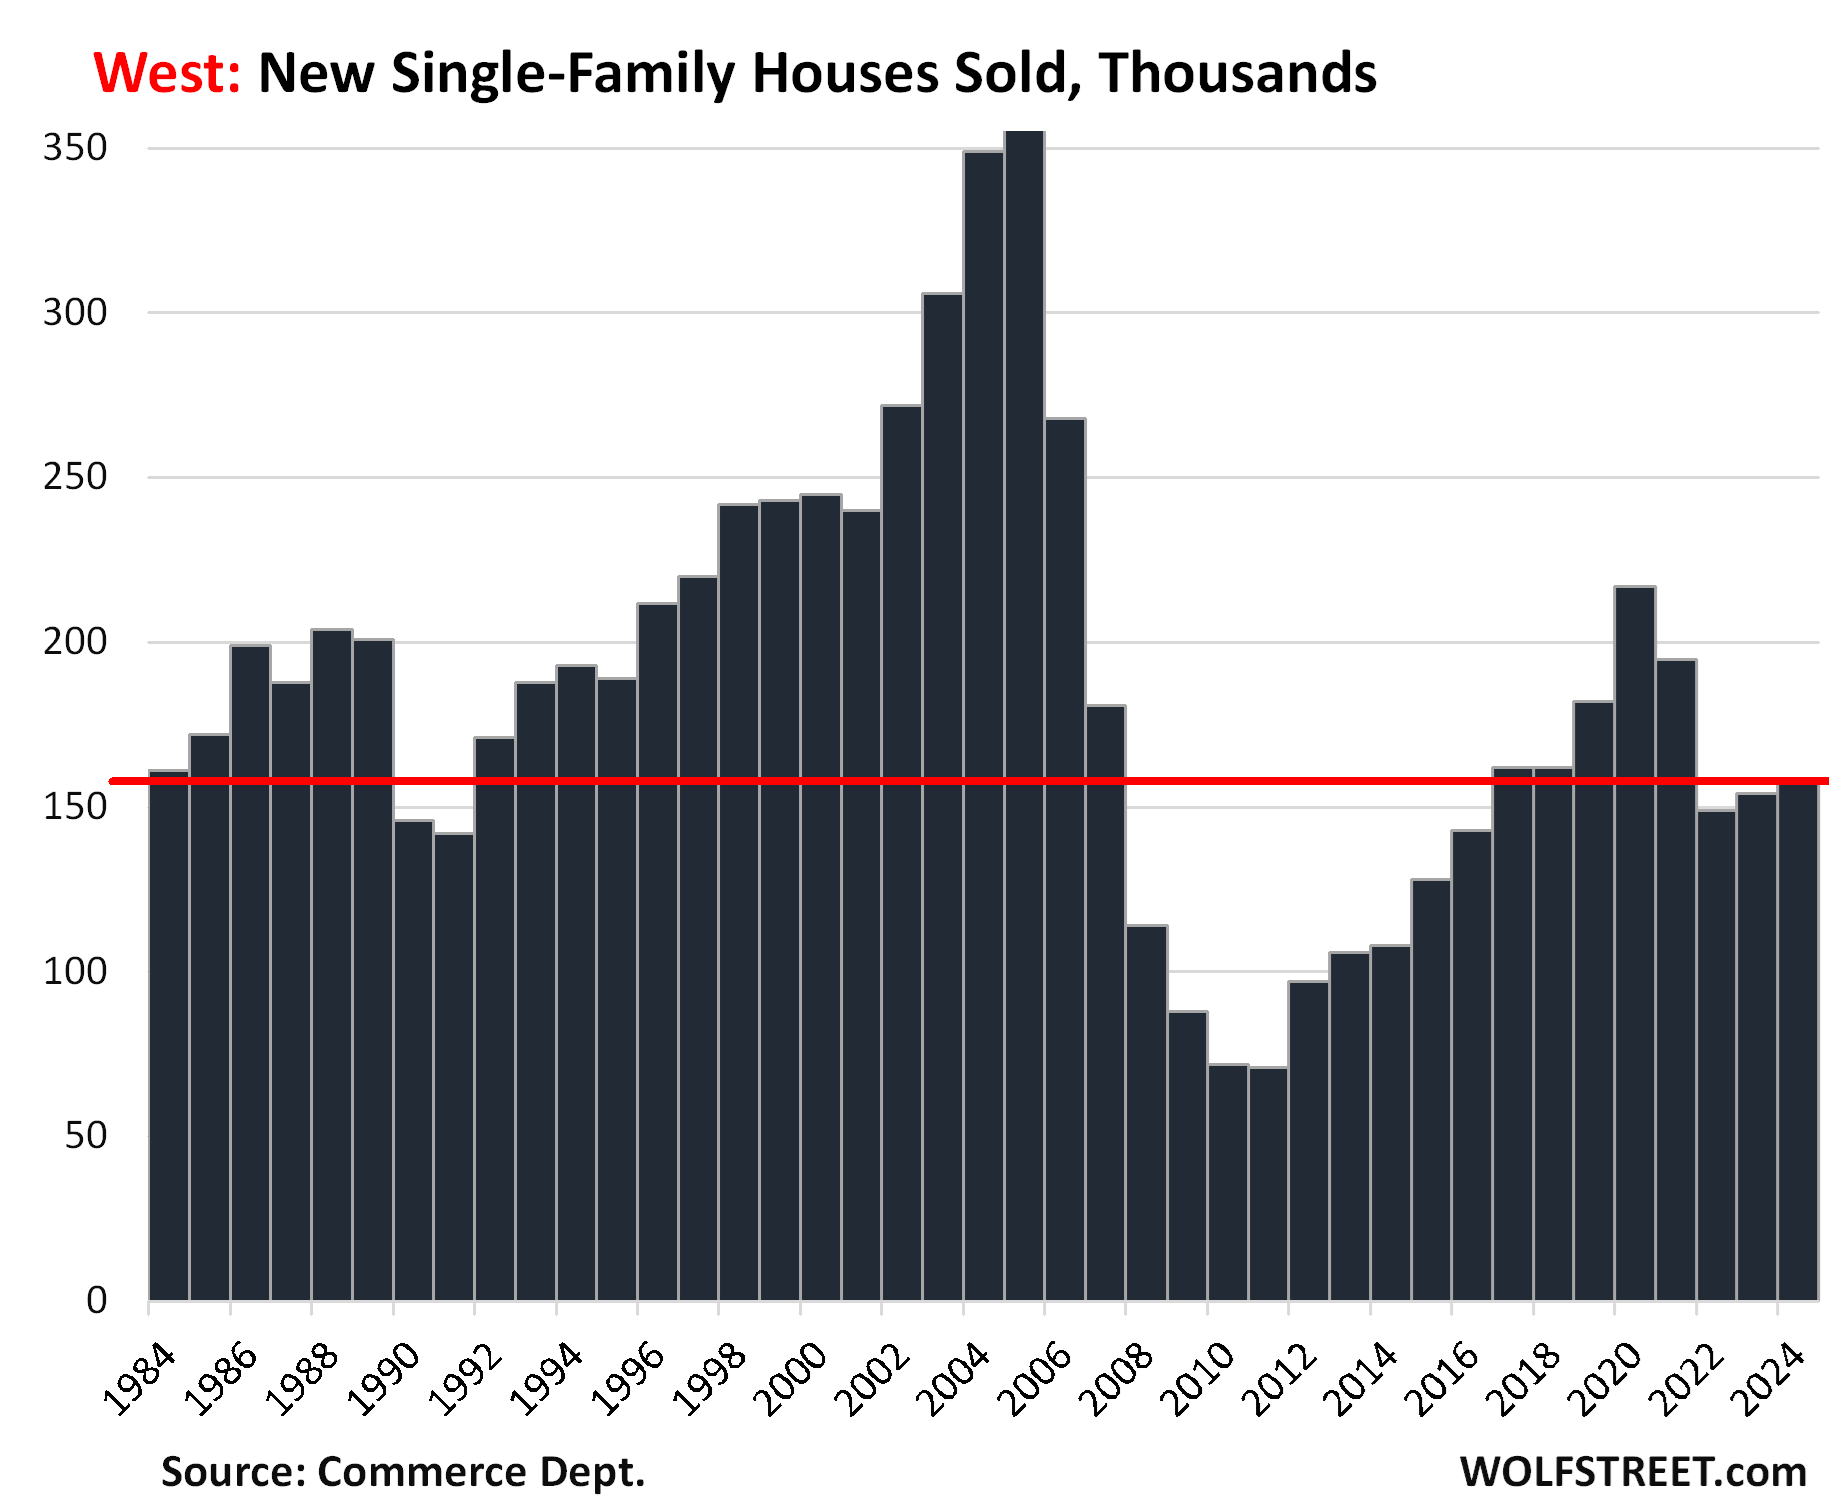
But sales have been anemic in the West because prices are way too high. In 2024, a total of 157,000 new houses were sold, down by 28% from 2020, and down by 14% from 2019. While annual sales were up from the prior two years, all three years were at the lower end of the scale, with only 2008-2016 and 1990 and 1991 having been even lower.

So lots of inventory piling up and sluggish sales:

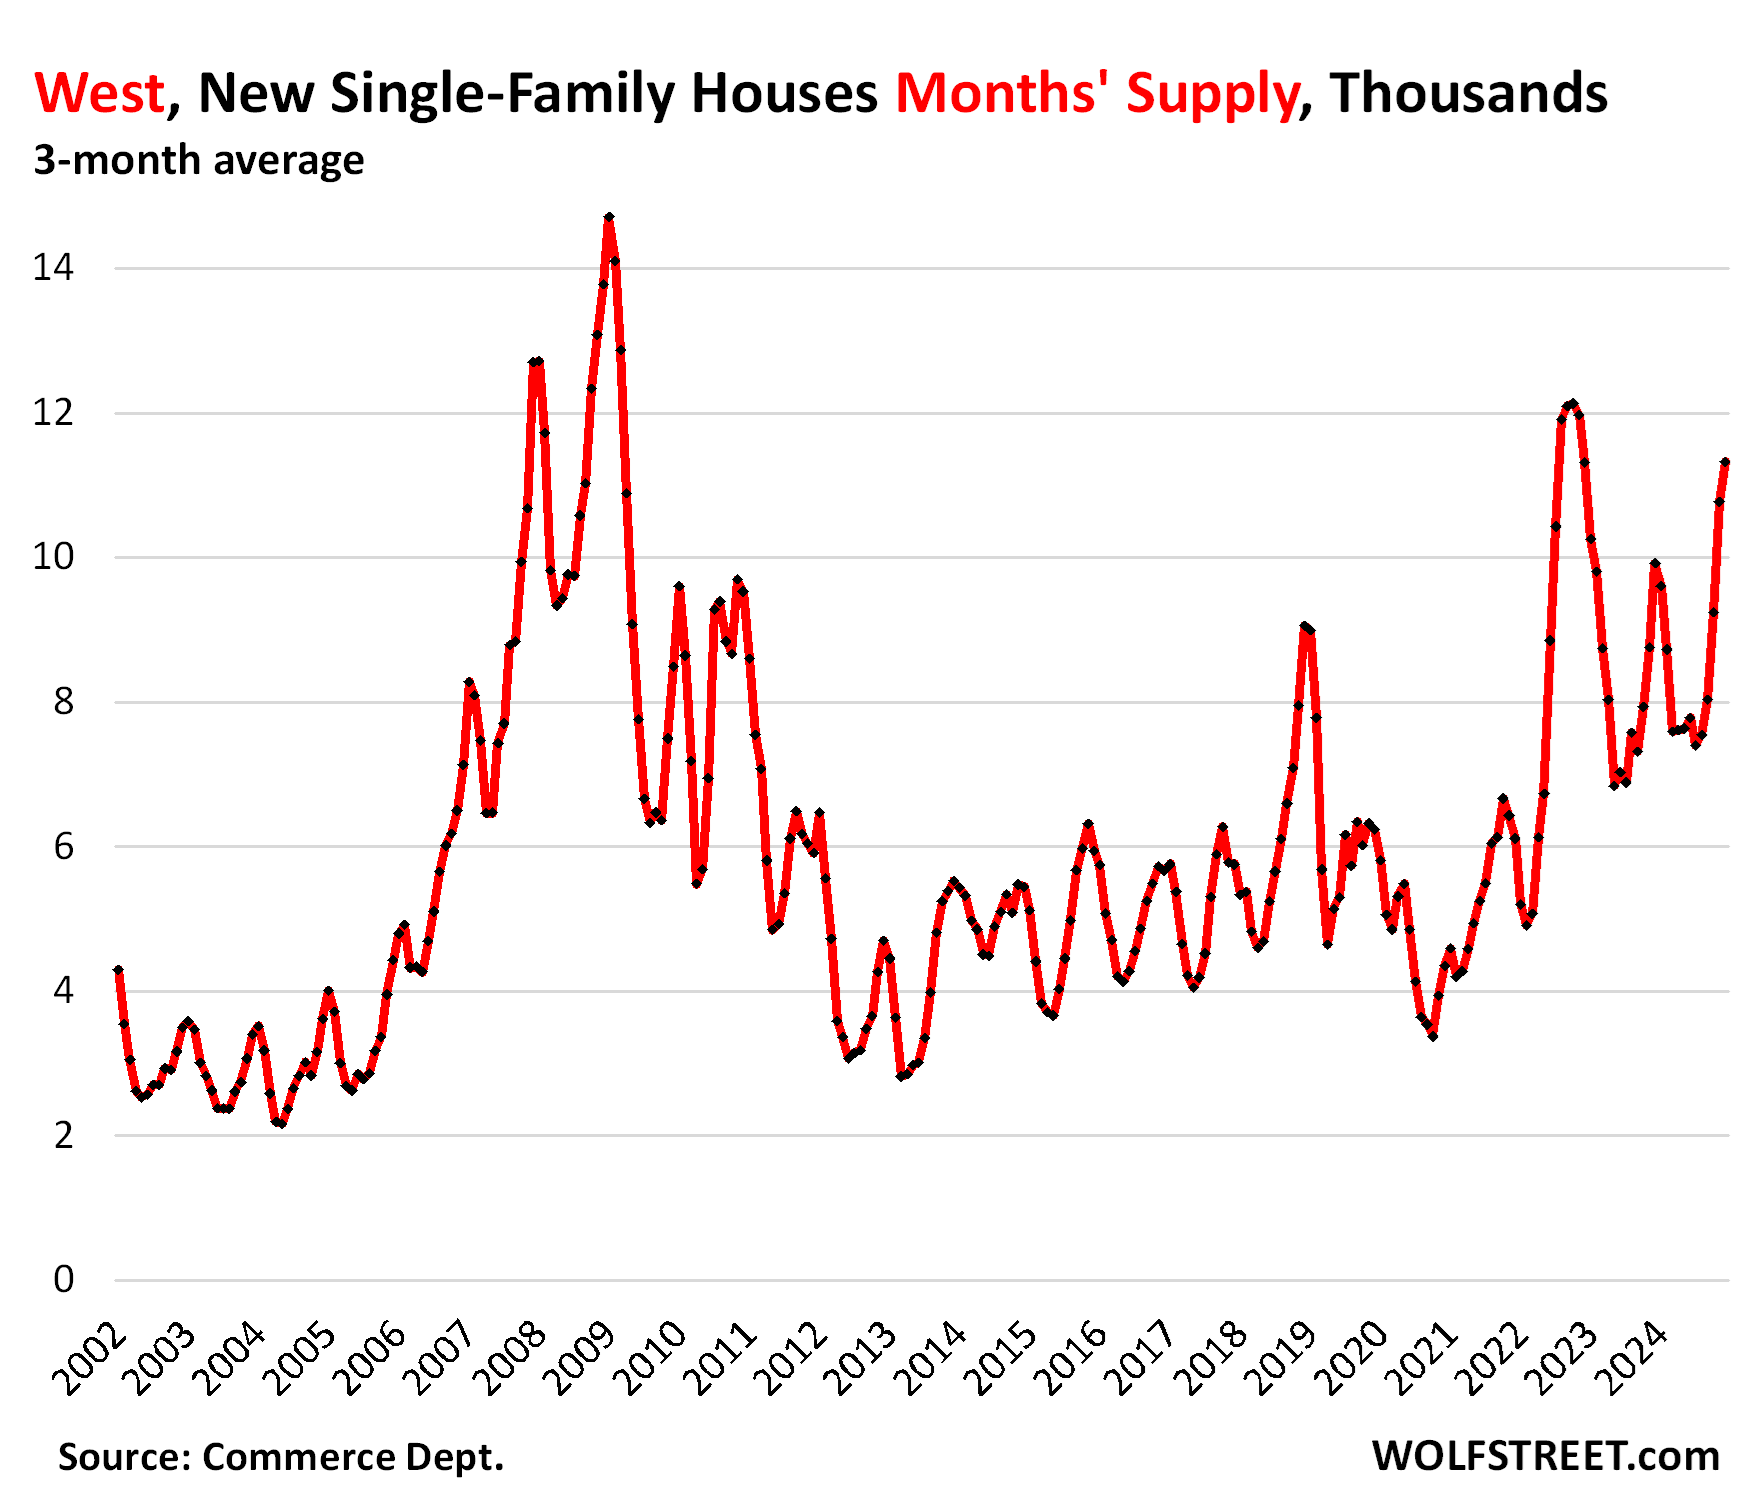
Supply has therefore spiked to 11.3 months on a three-month-average basis. There were only three brief periods with higher supply:

  • In late 2022 as the market for new houses was waylaid by the surge in mortgage rates, triggering a tsunami of cancellations of new-house purchases, as buyers who’s sighed the contract when rates were 3% or 4% couldn’t take delivery when rates were 6%.
  • Four months of November 2008 to February 2009.
  • Two months of December 2007 and January 2008.

The other two regions are not big players in the single-family market

The Northeast and Midwest are smaller in terms of the population, and much much smaller in terms of the market for new single-family houses. The regions are dominated by huge old cities, particularly the Northeast with New York City, Boston, Philadelphia, and the cities and urban areas around them. New construction is focused on multifamily to increase density and shorten commutes from the already unwieldy urban sprawl.

So there are only a few sales of new houses in those two regions, amid rising inventory and supply. But all of it is too small to really weigh on the national scale.

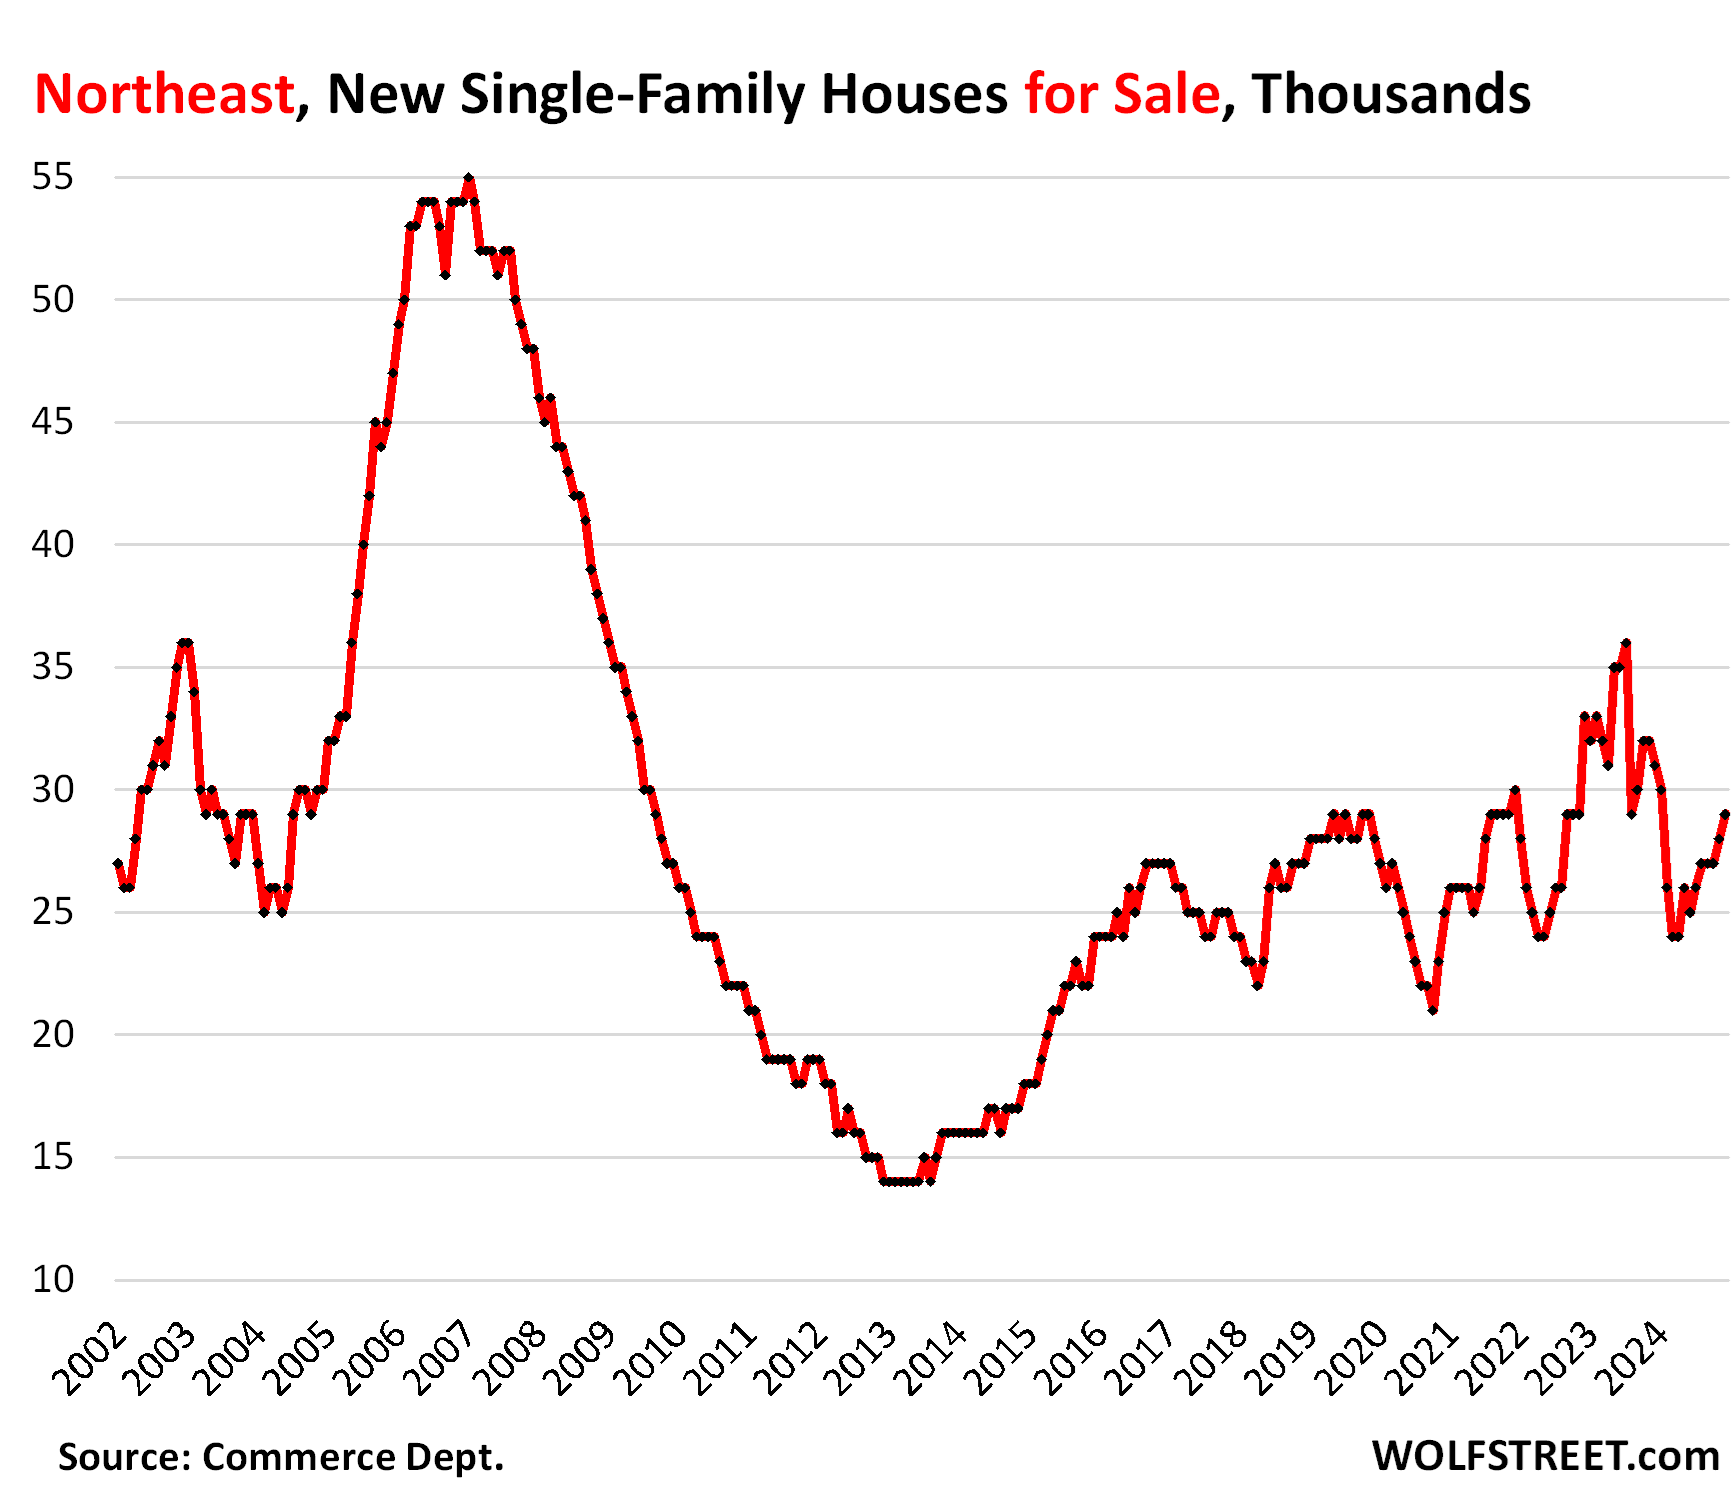
In the Northeast, only 33,000 new houses were sold in all of 2024, down by about two-thirds since the 1980s, but roughly in the range of the past 10 years.

The Census Bureau rounds sales on a monthly basis to the nearest 1,000 houses. In the Northeast, these rounded sales have been either 2,000 a month or 3,000 a month rounded. And on a few occasions 4,000 a month. We use annual sales here which would largely average out the big rounding errors of the monthly data.

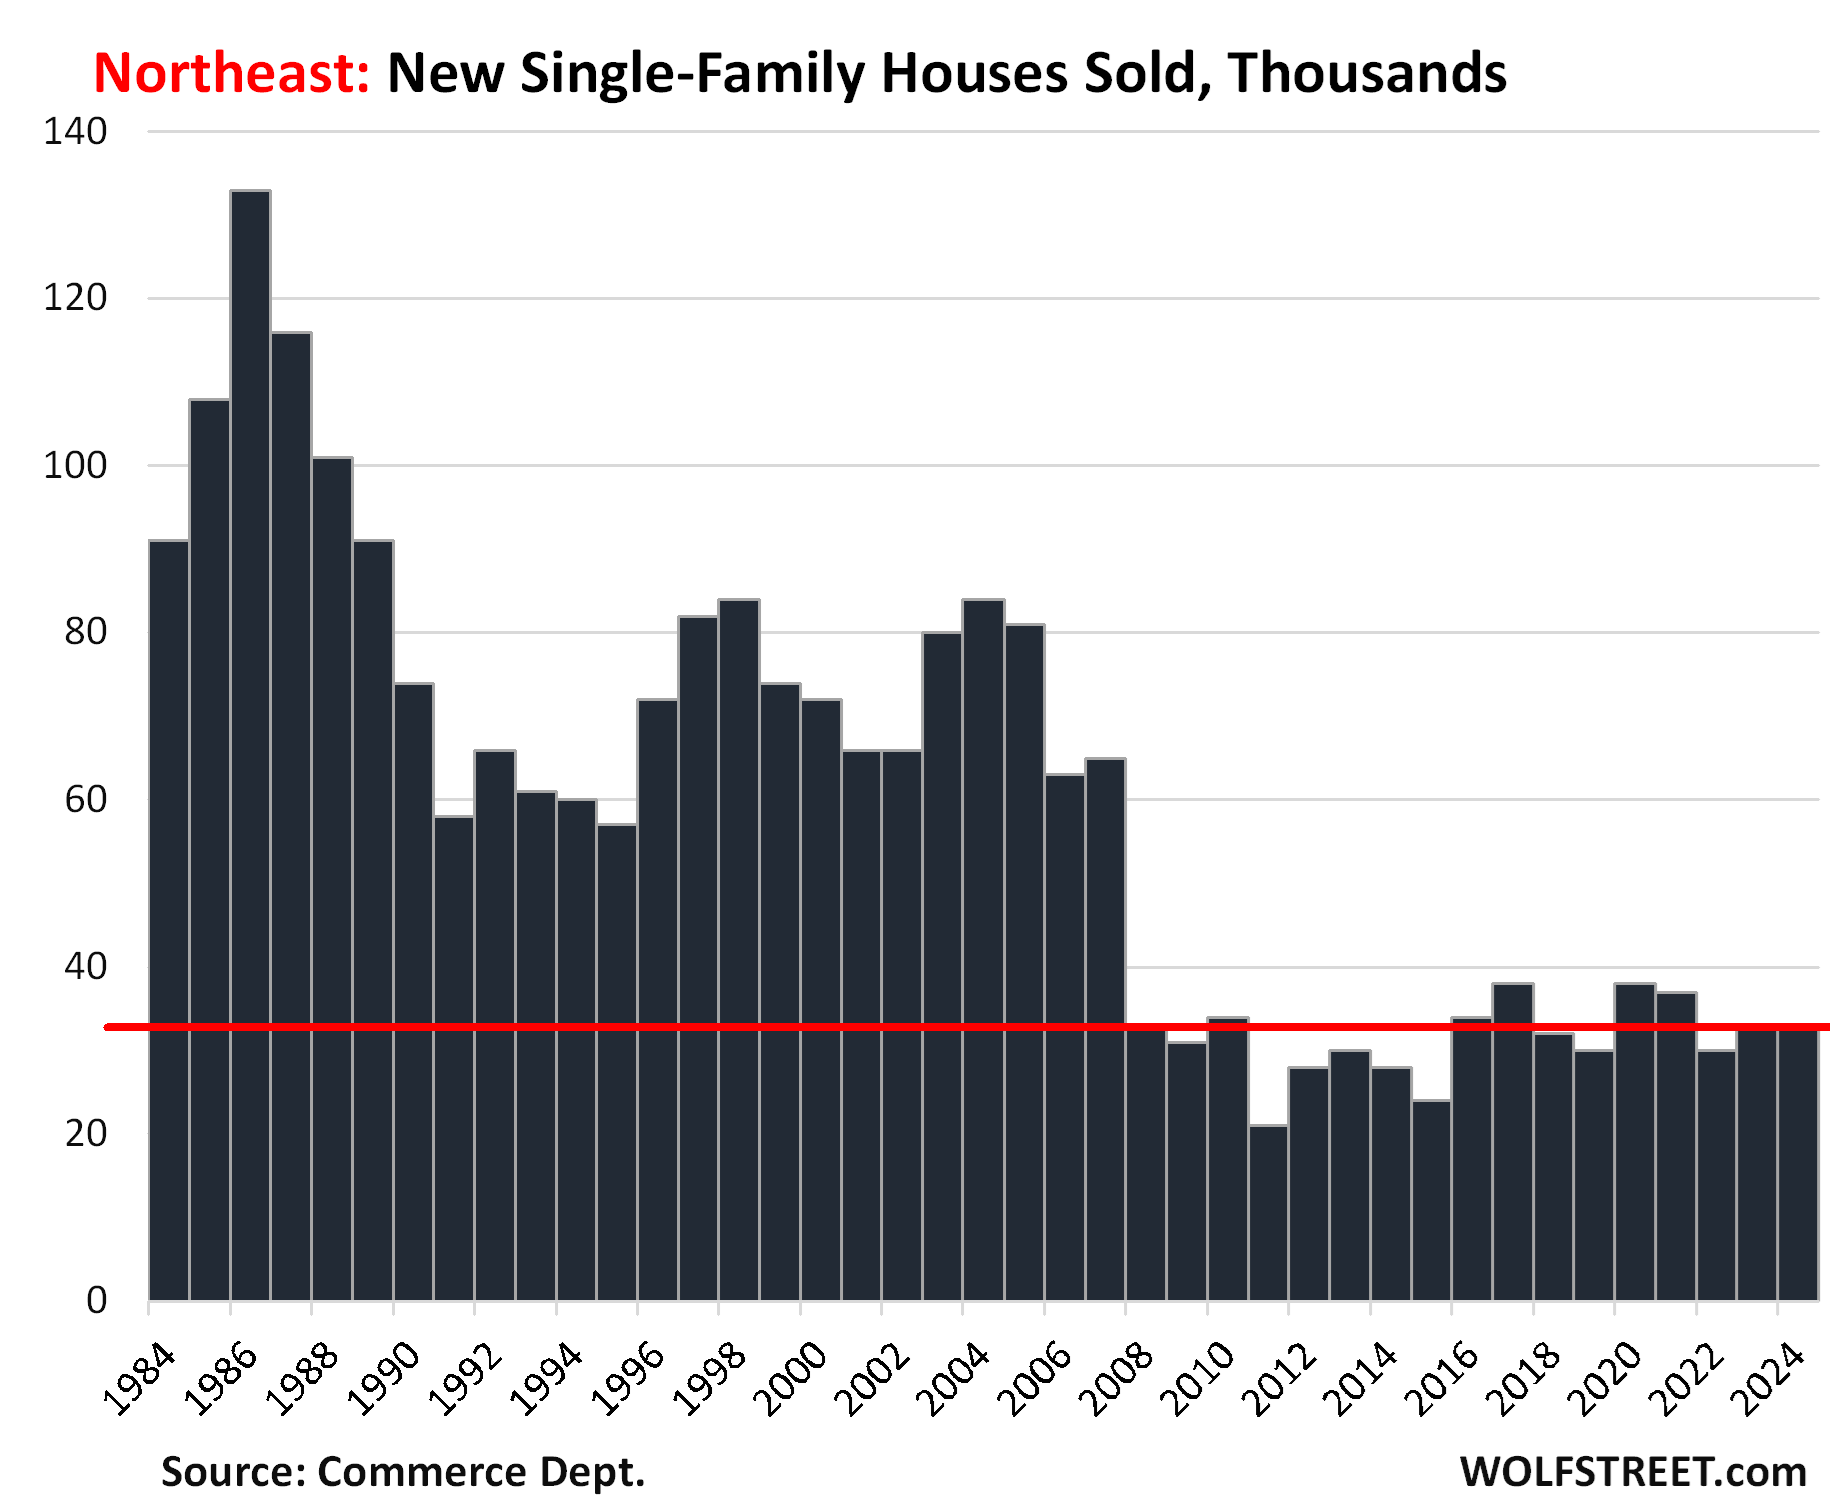
Inventory in the Northeast has been zigzagging higher over the past few years. Supply reached 17 months, by far the highest of any region. During the worst moments during the Housing Bust, supply reached 18 months. This is just not a big market for new single-family houses that would expand the urban sprawl further.

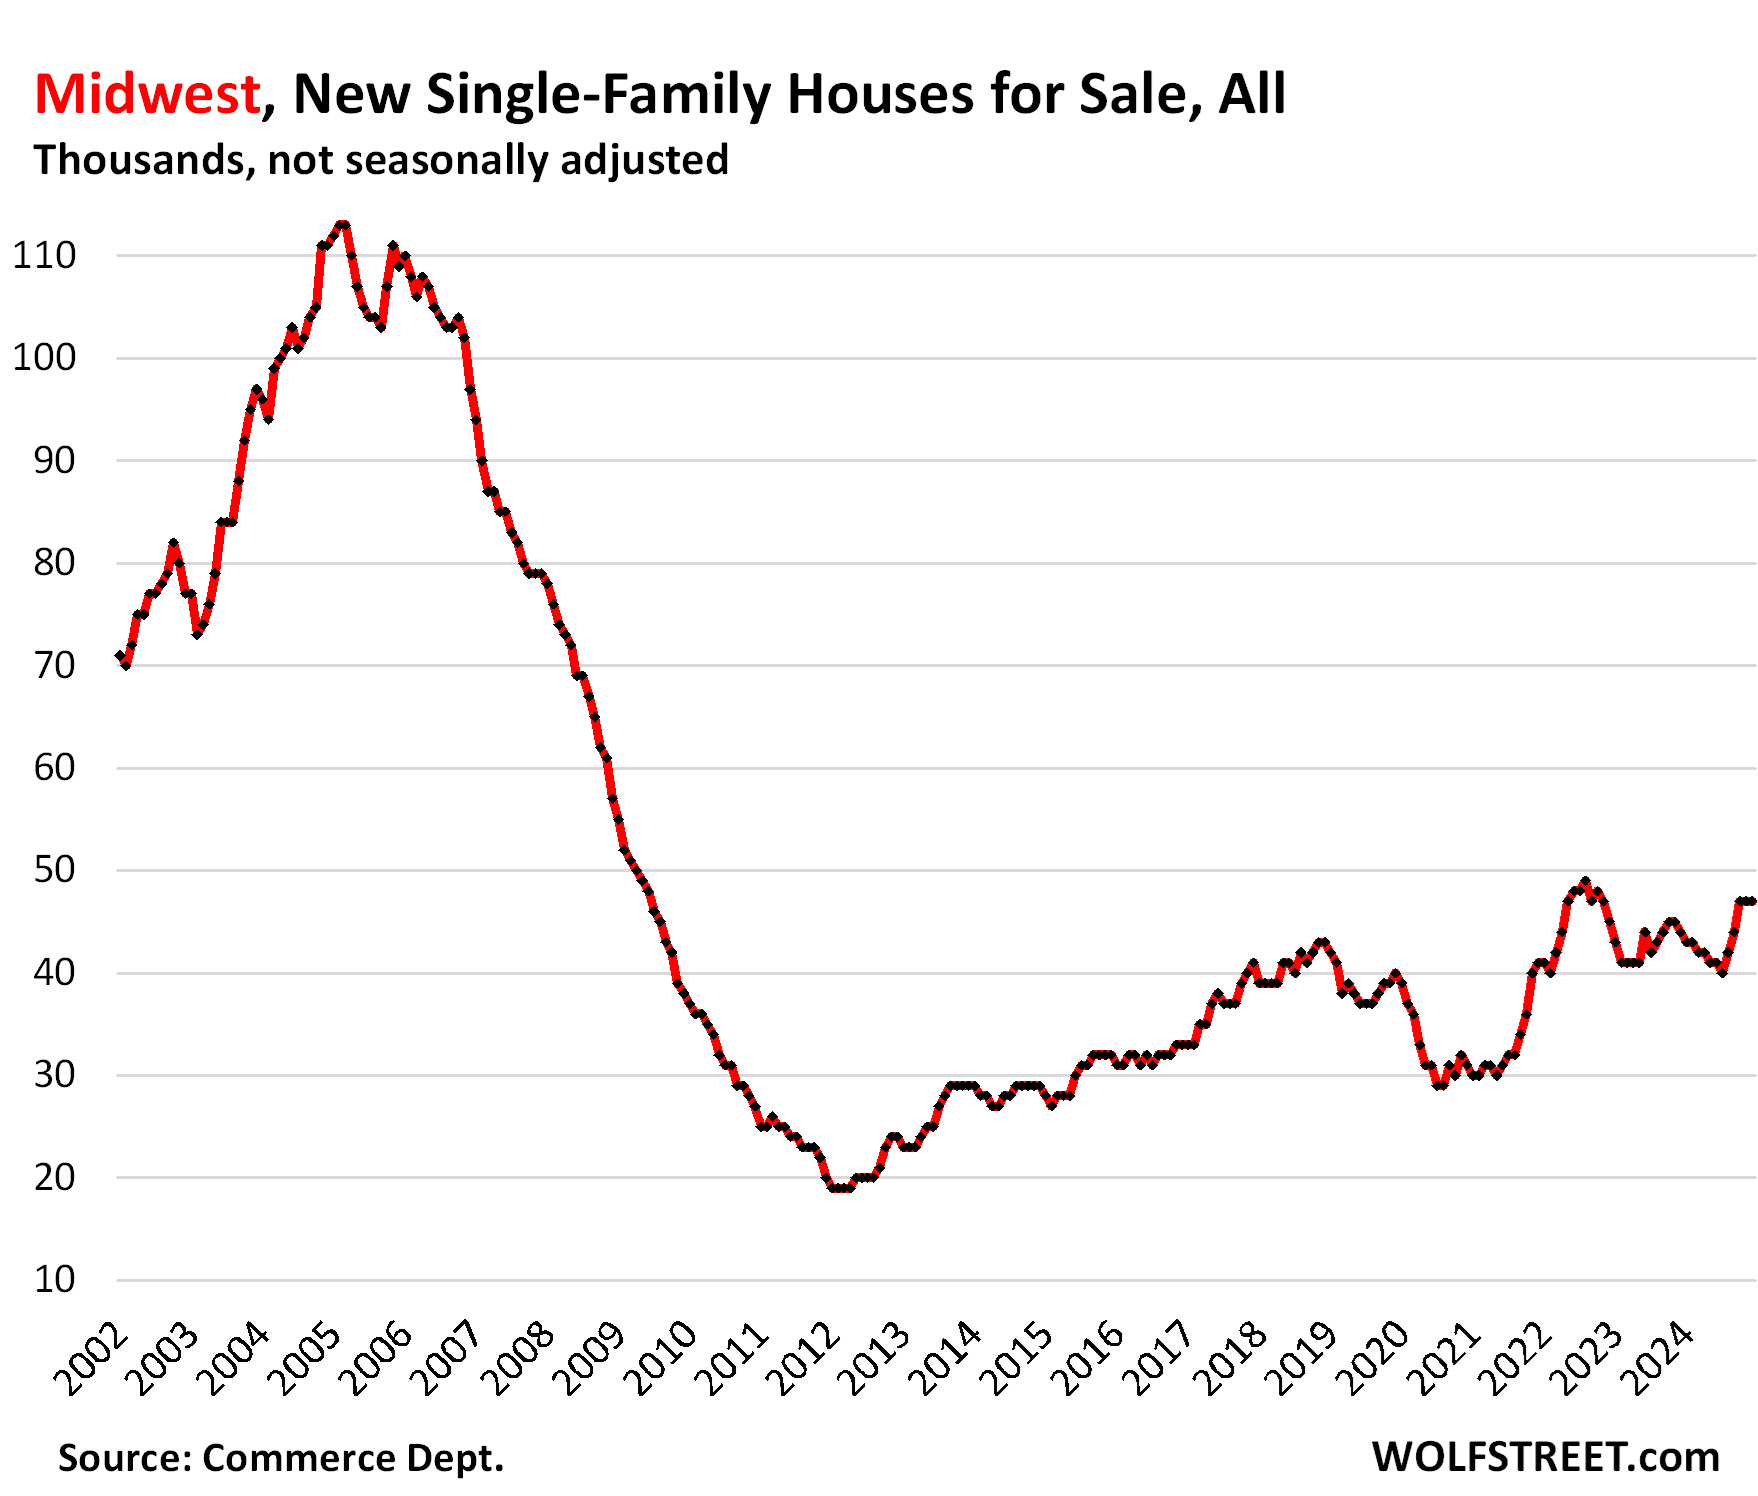
In the Midwest, sales of single-family houses in 2024 rose to 79,000:

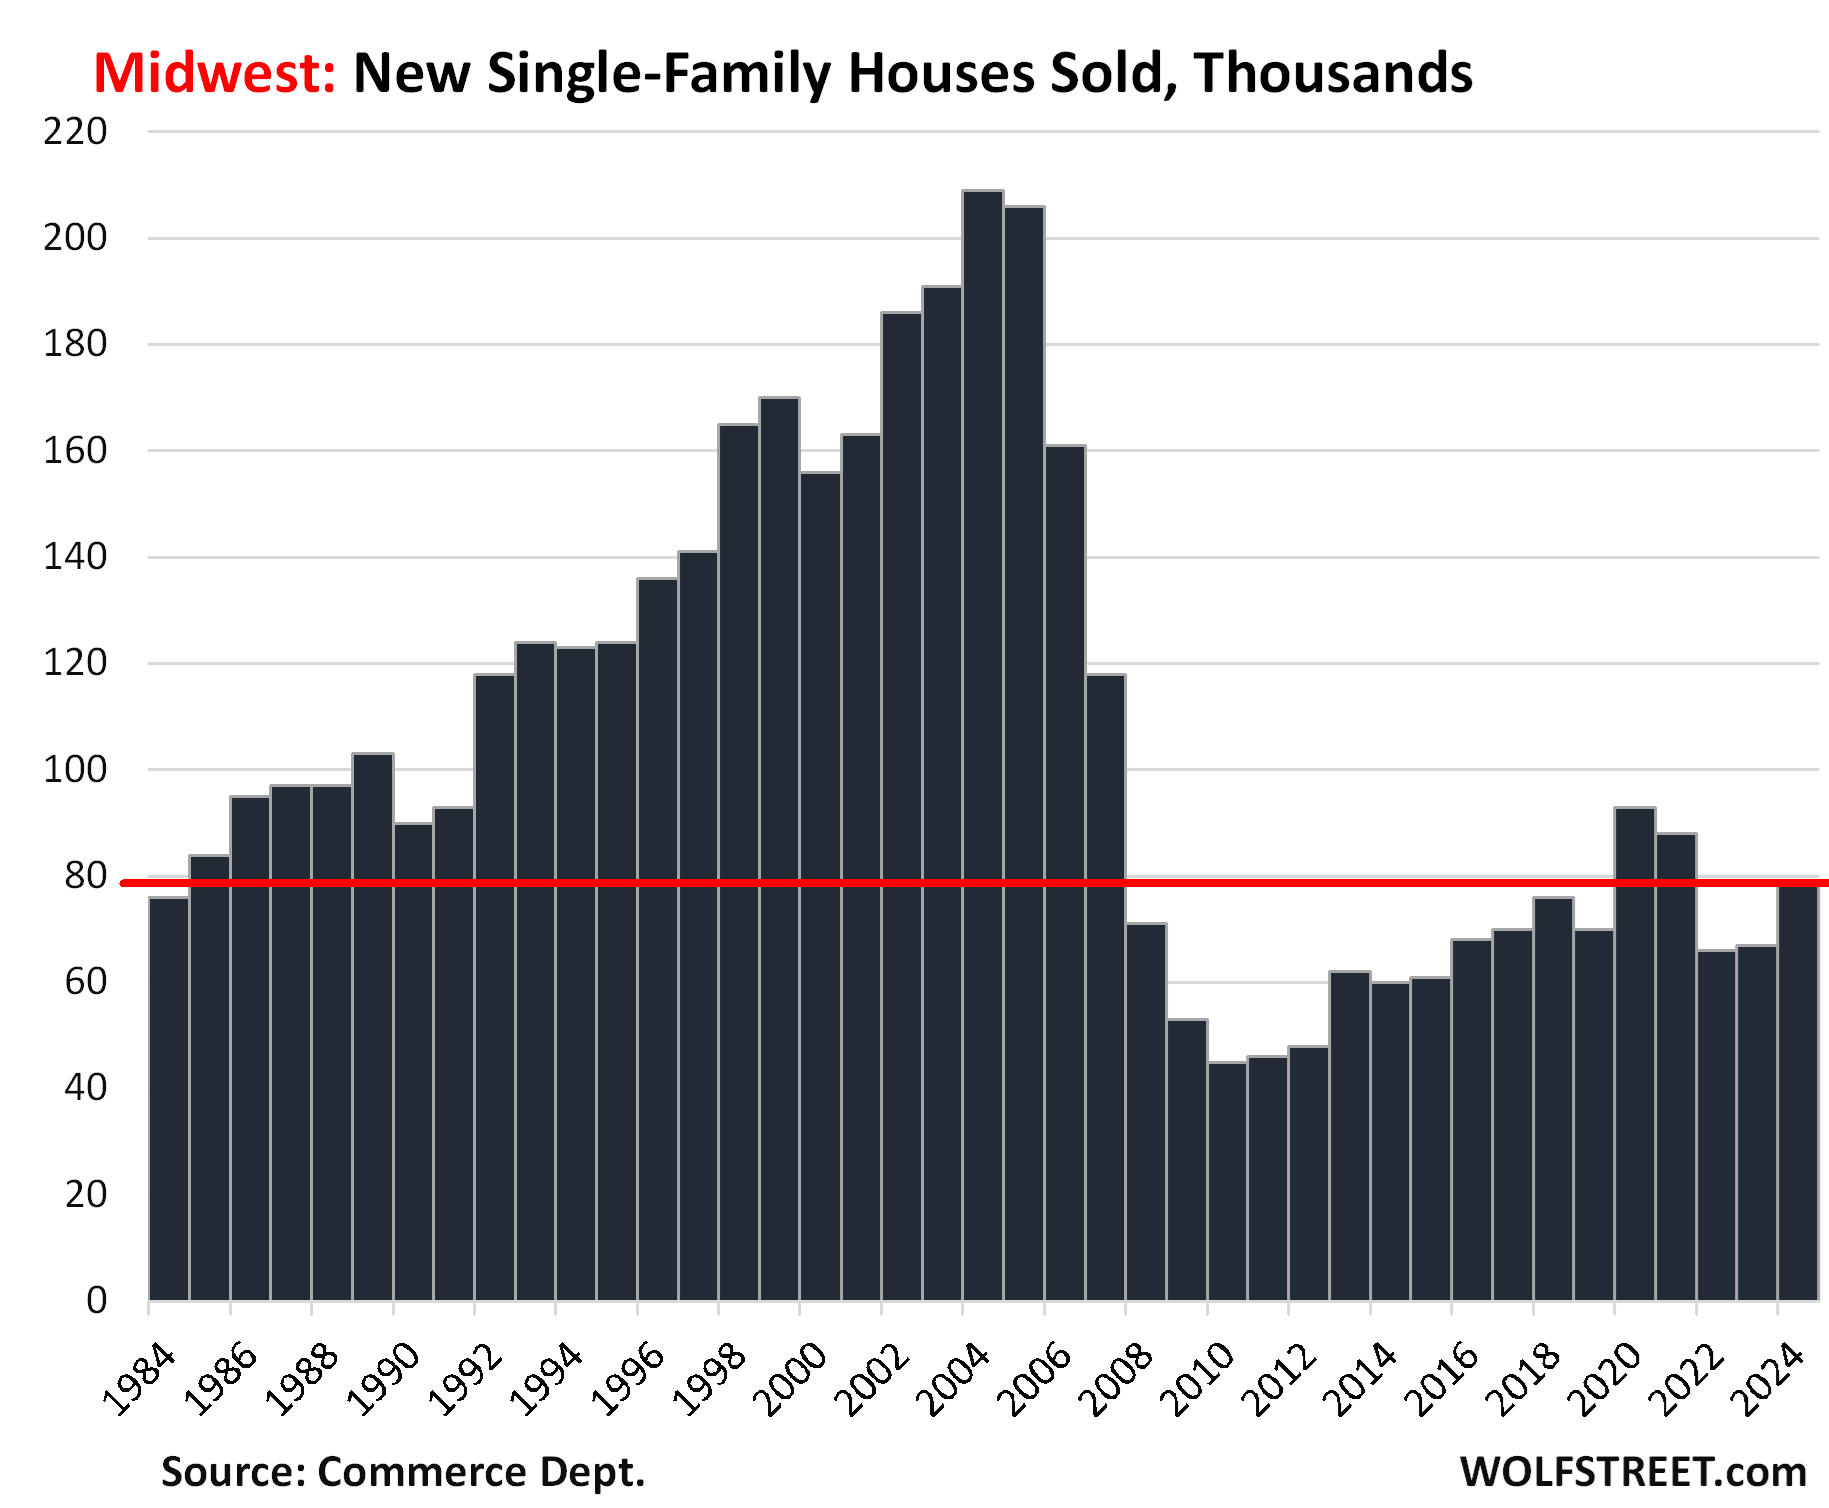
Inventory in the Midwest, at 47,000 houses over the past three months, is at the highest level since late 2022, and beyond that at the highest level since 2009. Supply exceeds 9 months on a three-month average basis.


The stock market gauge named after Warren Buffett just hit an all-time high, sending a warning worse than before the dot-com bubble burst

The stock market gauge named after Warren Buffett just hit an all-time high, sending a warning worse than before the dot-com bubble burst

Paolo ConfinoBy Paolo Confino

  • Market indicator that guides much of the investment philosophy of vaunted value investor Warren Buffett is signaling the stock market could be significantly overvalued.
One of Berkshire Hathaway chairman Warren Buffett’s favorite market metrics is flashing a warning sign.
The Buffett Indicator, which calculates the ratio of market cap of all U.S. publicly traded stocks to the country’s gross domestic product, is at the highest level in several decades, according to research from Kailash Capital Research. As of November 2024, the figure reached 230%, the highest on record, according to Kailash’s data. That type of market dynamic hasn’t been seen since March 2000 around the time the dot-com bubble burst. Back then, the market-to-GDP ratio had reached a record level of 175%.

Still, though market cap-to-GDP is instructive, it is not a perfect metric because it fails to account for the fact that many companies in the U.S. stock market sell their goods and services abroad, according to BCA Research chief strategist Dhaval Joshi.

“The one slight flaw or problem with the measure is that if the companies in the market cap [total] are global companies, which of course they are, then it’s a sort of a mismatch because you’re looking at the market capitalization of global companies versus U.S. GDP, effectively total sales in the United States,” Joshi said.

Malgari and his coauthor, Sanjeev Bhojraj, conceded this is a valid criticism and that running the same analysis on a global scale would illuminate whether these market dynamics are the new normal for the global economy or an aberration specific to the U.S.

However, they said the criticism also reinforces their overall point that these companies are overvalued; just as global trade can provide tailwinds, so too can it provide headwinds. Many of the largest firms—especially in tech—face fierce competition from companies in other parts of the world that could threaten their dominance. For example, Tesla and Apple’s main competitors are BYD and Huawei, two companies from China, Bhojraj noted.

“If you really think about a global economy, you should also be thinking about global competition,” he said.

Malgari and Bhojraj feel the evidence is clear. “Others are welcome to continue fighting with arithmetic truths, but we are not,” the two wrote in their report.

Though, there are some key differences between the current state of the market and that of years past. The financial might at the very top of the market, such as the Magnificent Seven megacap tech stocks, is unprecedented. For example, Apple generated over $108 billion in free cash flow in fiscal 2024 and, as of its latest earnings report, Alphabet had $93 billion in cash on hand.

“The technology companies tend to have really strong balance sheets and really earnings are quite stable and not as cyclical as in the past,” said Jose Torres, senior economist at Interactive Brokers, a brokerage firm in Greenwich, Conn.

Torres added that technology is now much more integrated into all facets of life, having been widely adopted by both people and companies. For tech companies at least, they have ample room to continue growing.

“Technology is becoming a significant growth driver, while back then it was just starting,” Torres said. “Now it’s sort of in everything we do so that, for that reason, this level of concentration isn’t as worrisome as in the past.”

The advent of AI would seem to only strengthen the hands of the major tech companies that drive much of the soaring valuations. Still, Buffett warned back in 1999 that a specific technology boom wouldn’t automatically translate into stock market gains. At the time, he pointed to two revolutionary technologies of the 20th century as evidence: automobiles and airplanes. By 1999, roughly a century after their invention, they had not yielded a noteworthy stock market darling, despite how widespread the technologies were.

“The key to investing is not assessing how much an industry is going to affect society, or how much it will grow, but rather determining the competitive advantage of any given company and, above all, the durability of that advantage,” Buffett said.

Investors will ask AI companies what they previously did of airplane and car manufacturers: turn gargantuan investments into even larger profits, according to Malgari. “It’s actually almost a perfect analog because somebody has to figure out how to make huge returns on capital to justify what’s going on right now,” he said.

As the Buffett Indicator continues to creep up, Buffett’s conglomerate Berkshire Hathaway exited some of its most profitable investments in single companies such as Bank of America and Apple, building up a historically large cash position in the process.

That has some investors wondering if the Oracle of Omaha does, in fact, know something they don’t.

Your Personal Bank Celebrates 25 Years of Transforming Financial Futures

Your Personal Bank Celebrates 25 Years of Transforming Financial Futures

Message From Ferenc Toth:
I am honored that an article regarding Your Personal Bank has been published in Business Insider, Yahoo Finance, and Benzinga, see article below: 
ARTICLE:

Phoenix, Arizona , June 23, 2025 (GLOBE NEWSWIRE) — Your Personal Bank™, the financial strategy platform founded by Ferenc Toth, is celebrating a major milestone: 25 years of helping individuals and families take control of their financial future. Built on a mission of financial literacy and independence, the company has evolved from a traditional insurance and annuity business into a nationally recognized advocate for innovative personal banking strategies.


Your Personal Bank

“When I started in this business, I was focused on retirement planning, IRAs, 401(k)s, and primarily annuities,” said Toth, who for four consecutive years ranked among the top annuity producers in the United States. “But when I joined the board of a bank in formation, it opened my eyes to a whole new world, one that individual investors had largely never been invited into.”

That insight led to the development of what is now known as Your Personal Bank™, a unique financial tool modeled on the same high cash value insurance strategies long used by banks and wealthy individuals. Once Toth introduced it to his agency’s 4,000-plus clients, the referrals began pouring in without any advertising. “We started hearing things like, ‘You have got to talk to my brother,’ or, ‘My business partner needs to hear this.’ That is when we knew we were onto something truly life-changing,” he said.

The company’s impact can be felt in the stories of real people. A tech manager in Seattle was able to retire in nearly half the time he expected. A real estate investor used the strategy to purchase over 50 properties. Another client weathered the fallout of divorce and financial hardship, emerging with her account intact, even after withdrawing all of her contributions over the years. “There is no other financial tool I know of that can do that,” said Toth. “It’s still growing for her because of the positive arbitrage.”

The journey took a major turn six years ago when Toth was invited to speak on a radio program. That appearance led to a radio show of his own, and within the first week, listeners began reaching out. Today, Your Personal Bank™ Radio airs on over 20 stations nationwide. With no sponsors and no scripted talking points, the show gives Toth the freedom to educate and empower audiences with candid, timely conversations about finance.

Despite his national reach, Toth’s focus remains unchanged. “The future is about continuing this mission, fine-tuning the message, expanding the reach, and helping more people understand that this tool is not just for the ultra-wealthy. It’s a viable, practical solution for real people,” he said.

Reflecting on the company’s growth, Toth notes the shift in public awareness. He shared, “Fourteen years ago, I had asked a room of financially literate people if they had heard of the concept. Maybe one or two would raise their hand. Today, it’s closer to a third. That tells me we are making a difference.”

As Your Personal Bank™ celebrates its 25th anniversary, Toth remains as committed as ever to helping Americans break free from conventional financial thinking and discover a smarter, more flexible way to build wealth. “This is not about selling a product,” he emphasized. “It’s about changing lives.”

Name: Your Personal Bank

Email: ferenc@yourpersonalbank.com

Disclaimer:

The information provided in this article is for general informational purposes only and does not constitute financial, investment, legal, or other professional advice. The views expressed are those of the author and do not necessarily reflect the opinions of any affiliated organizations. Before making any financial decisions, you should consult with a qualified financial advisor. While every effort has been made to ensure the accuracy of the information herein, no guarantee is given that the information is complete, accurate, or up-to-date. The author and publisher accept no liability for any loss or damage resulting from reliance on the content of this article.