by Wesley Franco | Jul 16, 2025 | financial news
Social Security and Medicare Boards of Trustees SUMMARY OF THE 2024 ANNUAL REPORTS
The Trustees of the Social Security and Medicare trust funds report on the current and projected financial status of the two programs each year. This document summarizes the findings of the 2024 reports. As in prior years, we found that the Social Security and Medicare programs both continue to face significant financing issues.
Based on our best estimates, this year’s reports show that:
- The Old-Age and Survivors Insurance (Social Security) Trust Fund will be able to pay 100 percent of total scheduled benefits until 2033, unchanged from last year’s report. At that time, the fund’s reserves will become depleted, and continuing program income will be sufficient to pay 79 percent of scheduled benefits.
- The Disability Insurance (DI) Trust Fund is projected to be able to pay 100 percent of total scheduled benefits through at least 2098, the last year of this report’s projection period. Last year’s report projected that the DI Trust Fund would be able to pay scheduled benefits through at least 2097, the last year of that report’s projection period.
- If the OASI Trust Fund and the DI Trust Fund projections are combined, the resulting projected fund (designated OASDI) would be able to pay 100 percent of total scheduled benefits until 2035, one year later than reported last year. At that time, the projected fund’s reserves will become depleted, and continuing total fund income will be sufficient to pay 83 percent of scheduled benefits. (The two funds could not be combined unless there were a change in the law, but the combined projection of the two funds is frequently used to indicate the overall status of the Social Security program.)
- The Hospital Insurance (Medicare) Trust Fund will be able to pay 100 percent of total scheduled benefits until 2036, 5 years later than reported last year. At that point, that fund’s reserves will become depleted, and continuing program income will be sufficient to pay 89 percent of total scheduled benefits.
- The Supplemental Medical Insurance (SMI) Trust Fund is adequately financed into the indefinite future because, unlike the other trust funds, its main financing sources–enrolled beneficiary premiums and the associated federal contributions from the Treasury–are automatically adjusted each year to cover costs for the upcoming year. Although the financing is assured, the rapidly rising SMI costs have been placing steadily increasing demands on beneficiaries and general taxpayers.
The projected long-term finances of the combined OASDI fund improved this year primarily due to an upward revision to the level of labor productivity over the projection period and a
lower assumed long-term disability incidence rate. These improvements were partially offset by a decrease in the assumed long-term total fertility rate. The revision to labor productivity was based on stronger economic growth in 2023 than had been anticipated in last year’s reports. The Trustees lowered the long-term disability incidence and fertility rate assumptions based on continued low levels in both series.
The projected long-term finances of the HI Trust Fund also improved this year relative to last. This improvement was due to several factors, including a policy change correcting for the way medical education expenses are accounted for in Medicare Advantage rates starting in 2024, higher payroll tax income resulting from the stronger-than-expected economy, and actual 2023 expenditures that were lower than projected last year.
The change in the projected long-term finances of the SMI Trust Fund from last year’s report varies over the projection period. For Part B, the long-range projections as a percent of GDP are over than those projected last year through 2056 and higher thereafter. This change reflects the combined effects of lower projected spending for outpatient hospital and home health agency services and revised GDP projections. For Part D, the expenditure share of GDP is projected to be higher than last year’s early in the projection period and to continue to vary but become more similar to last year’s estimates later in the projection period. These changes largely reflect revisions to drug utilization, enrollment, and GDP projections.
Lawmakers have many options for changes that would reduce or eliminate the long-term financing shortfalls. Acting sooner rather than later will allow consideration of a broader range of solutions and provide more time to phase in changes so that the public has adequate time to prepare.


by Wesley Franco | Jul 16, 2025 | financial news
Adam ZakiReporter
In what would be a CFO’s worst nightmare, the Department of Defense (DoD) has failed its seventh audit in a row since its first in 2018. While the consequences of audit failures have caused major issues for private businesses, the country’s largest government agency, which has a 2024 budget of $824 billion — a $26.8 billion increase from 2023 — has been given until 2028 to account for its spending. In the latest audit of the 28 reporting entities audited within the DoD:
- Nine received an unmodified opinion
- Fifteen received disclaimers
- One received a qualified opinion
- Three opinions remain pending
Of the 15 disclaimers, insufficient information about the accounts was the primary reason. The agency is walking a fine line under federal law, as the CFO Act of 1990 requires all federal agencies in the executive branch to prepare auditable financial statements and undergo audits.
It’s possible that continued financial disarray could undermine public confidence and affect the department’s ability to allocate resources effectively, potentially impacting U.S. military readiness. During a press conference last week, Michael McCord, the DoD comptroller and CFO, acknowledged public concerns about his team’s challenges but said progress toward the 2028 goal is improving.
“This result was not a surprise, and I know that on the surface it doesn’t sound like we’re making progress. However, that is not the case,” said McCord. “I believe the department has turned a corner in its understanding of the challenges and more importantly, in addressing those challenges, momentum is on our side.”
The DoD’s fiscal performance is an outlier. Most federal agencies, excluding the DoD and the Department of Education, comply with the CFO Act and receive clean or qualified opinions in their audits. Critics argue the DoD’s vast and complex financial system contributes to these challenges. Still, a lack of accountability also raises concerns about the department’s capacity to manage such a substantial portion of the federal budget.

*This figure is higher than the DoD’s budget because it encompasses things like overseas contingency operations and defense-related spending in other federal departments.
Though the CFO Act does not require an unmodified opinion from an audit, the DoD, whose spending is surpassed only by Social Security, healthcare and net interest on the national debt, has been given a timetable of fewer than four more years by Congress to secure an unmodified audit opinion by fiscal 2028. Currently, the Pentagon’s success rate is 32%.
Failure to meet the 2028 deadline could have serious consequences, including intensified congressional oversight, reduced discretionary spending or stricter budgetary controls on defense allocations. Even areas of the DoD’s audit spending could come into question, as the latest audit was conducted by teams of independent public accountants and the Office of Inspector General within the DoD and cost taxpayers a whopping $178 million.
https://www.cfo.com/news/pentagon-fails-7th-audit-in-a-row-michael-mccord-cfo-dod-pentagon/733313/

by Wesley Franco | Jul 16, 2025 | financial news
The United States is currently in a “death spiral” of debt that could lead to an economic “heart attack” if both parties do not work together to start cutting immediately, according to Ray Dalio, the founder of the world’s largest hedge fund.
During a recent conversation on “The All-In Podcast” with co-host David Friedberg, Dalio noted that a “death spiral” typically refers to when a company or government has too much debt and must borrow to service it. According to Dalio, investors are acutely aware of this, which is causing credit to get worse and interest rates to increase.
Dalio, the founder of Bridgewater Associates, says this is the worst thing that can happen to a heavily indebted entity. He notes that the key question is whether the debt creates a large enough income to mitigate this issue.
“That’s like, I don’t know, eating vegetables or something. It’s a healthy process. And if not, credit begins to build up this debt, it begins to become like plaque in the arteries. And you can measure it just like you could measure it in the arteries, and you can see how it constricts that circulatory system,” Dalio told “All-In.”
SCOOP: KEY CONSERVATIVE CAUCUS DRAWS RED LINE ON HOUSE BUDGET PLAN
Ray Dalio and David Friedberg
Ray Dalio, the founder of the world’s largest hedge fund, warned “The All-In Podcast” co-host David Friedberg of serious economic consequences is the national debt is not addressed quickly. (The All-In Podcast)
If interest and debt service continuously constrict a government’s money supply, Dalio claims this can lead to an “economic debt heart attack.”
A large amount of debt creates the need for somebody to buy it. Debt risks not only create the urgency for new supply to be offered, but holders may also sell those debt assets, leading to an overwhelming supply relative to demand, according to Dalio.
In the event that the debt service burden rises or there is a big supply-demand imbalance, the government’s central bank can print more money and buy it. If they do not, the price of the debt must rise to constrict borrowing, snowballing to the constriction of non-existent credit, in turn weakening the economy and causing bad economic conditions.
Dalio says the government can let that happen or print money and buy the debt to monetize it. However, this will cause inflation and lower the value of the debt.
“In either case, you don’t want to hold that debt because either there’s a debt service problem or there’s a depreciation,” he adds.
BLACK CAUCUS CHAIR ACCUSES TRUMP OF ‘PURGE’ OF ‘MINORITY’ FEDERAL WORKERS
National debt Trump and Ray Dalio
The U.S. national debt has exceeded $36 trillion. (All-In Podcast/Jemal Countess/Peter G. Peterson Foundation/Chip Somodevilla/Getty Images)
Today, the U.S. has $36.4 trillion of federal government debt and a Gross Domestic Product (GDP) of 29.1 trillion, giving a debt-to-GDP ratio of 125%. This ratio has climbed steadily since the pandemic began in 2020, when the federal government debt was $20 trillion, and GDP was just $21 trillion. Since the pandemic, federal government debt has risen by 80%, while GDP has climbed by 38%.
Despite recent efforts to cut interest rates again, markets have traded treasuries down, causing the long-term interest rates of U.S. debt to spike up to levels not felt since just before the 2008 global financial crisis. To keep the economy growing, the U.S. government is running a nearly $2 trillion annual deficit, nearly 7% of GDP, while paying over $1 trillion per year in interest alone on the existing outstanding debt.
Dalio expressed a sense of urgency in relation to mounting debt, wading into the potential benefits of the Department of Government Efficiency (DOGE) and how the need to cut costs will inevitably accentuate already entrenched political divisions.
Touting his personal solution, Dalio said the deficit, which is the equivalent of bonds selling, must be cut from 7.5 percent down to 3 percent of GDP.
DOGE ANNOUNCES MORE THAN $1B IN SAVINGS AFTER CANCELING 104 FEDERAL DEI CONTRACTS

Congress is racing to execute the recommendations of Trump’s new DOGE commission. (Getty Images)
“Different people have different views as to how to cut it. Forget it. I don’t really care,” Dalio said. “Just, you have to have a unified agreement. Everybody in Congress and the president and so on should pledge to do that. And then the question is how to do it. But they should know that number (equivalent to around 900 billion a year).”
Dalio worries that the timeline to close this gap may be too long. He says it’s not just a matter of DOGE but also less regulation and productivity changes, which could, in part, come from artificial intelligence (AI) or even revenue produced by tariffs and translate into profit.
When asked if America is better off with President Donald Trump versus former President Biden in the financial context, Dalio said, “Yes, I do believe we are.”
“In terms of profitability and the likelihood of cutting, I think the Republicans are probably more likely to make these moves than the Democrats. But you also have to take into consideration the impacts, the social impacts and the other impacts that are going to come from this. We’re at a civil war internally and we’re at an international war simultaneously. So, there are second-order effects. I think the main thing is to take those numbers and make them real at 3 percent,” he continued.
TOP DOGE LAWMAKER SAYS TRUMP ‘ALREADY RACKING UP WINS FOR TAXPAYERS’ WITH EFFICIENCY INITIATIVES

Pie chart on government spending. (Fox News)
But these cuts will be brutal, according to Dalio. He notes that “how the pie is divided” with respect to government budgeting is going to be very political and the “disruptive effects will be enormous.”
“We’re really all guessing on how disruptive those effects will be. It’s too much of a – but you’re absolutely right. Lots of jobs are going to be lost,” he said. “Lots of change is going to happen in terms of turbulence. And do we have a plan? How could we even agree on a plan of how to deal with that? I don’t think we’re in a time, it may be in the rest of our lifetimes, where that agreement is going to be easy.”
CLICK HERE TO GET THE FOX NEWS APP
The Economic Policy Innovation Center (EPIC) released a new model in December that said it is “possible” that the U.S. government would exhaust the ability to pay its debts by June 16, 2025.
“The government is projected to run about a $2 trillion deficit next year. And so that means that the spending obligations that Congress and the government have incurred are a lot more than what we’re going to bring in tax revenues,” Matthew Dickerson, director of Budget Policy at EPIC, told Fox News Digital. “To be able to pay the things the government has promised to pay on time, you need to increase the debt limit.”
Nikolas Lanum is a Video Editor for Fox News Digital.
by Wesley Franco | Jul 16, 2025 | financial news
Prices Are Still Way too High. Something has to give.
Yesterday, we looked at the surge of new completed “spec” houses for sale, and at the surge of new houses for sale at all stages of construction, for the US overall. Now we’ll look at at new houses for sale in the four regions of the US.
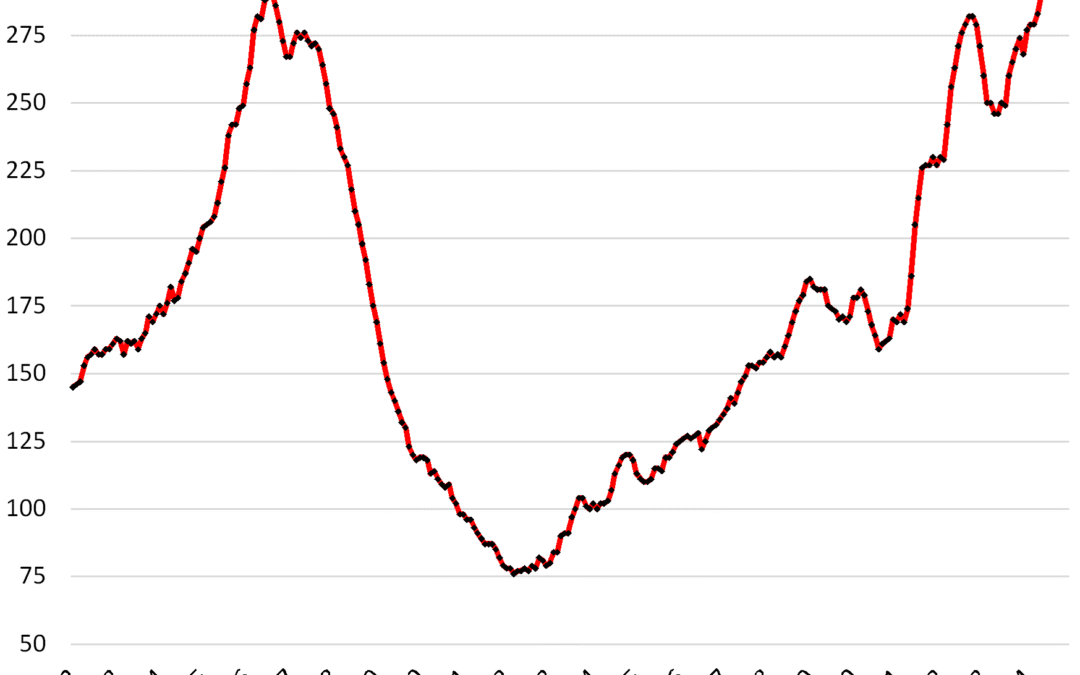
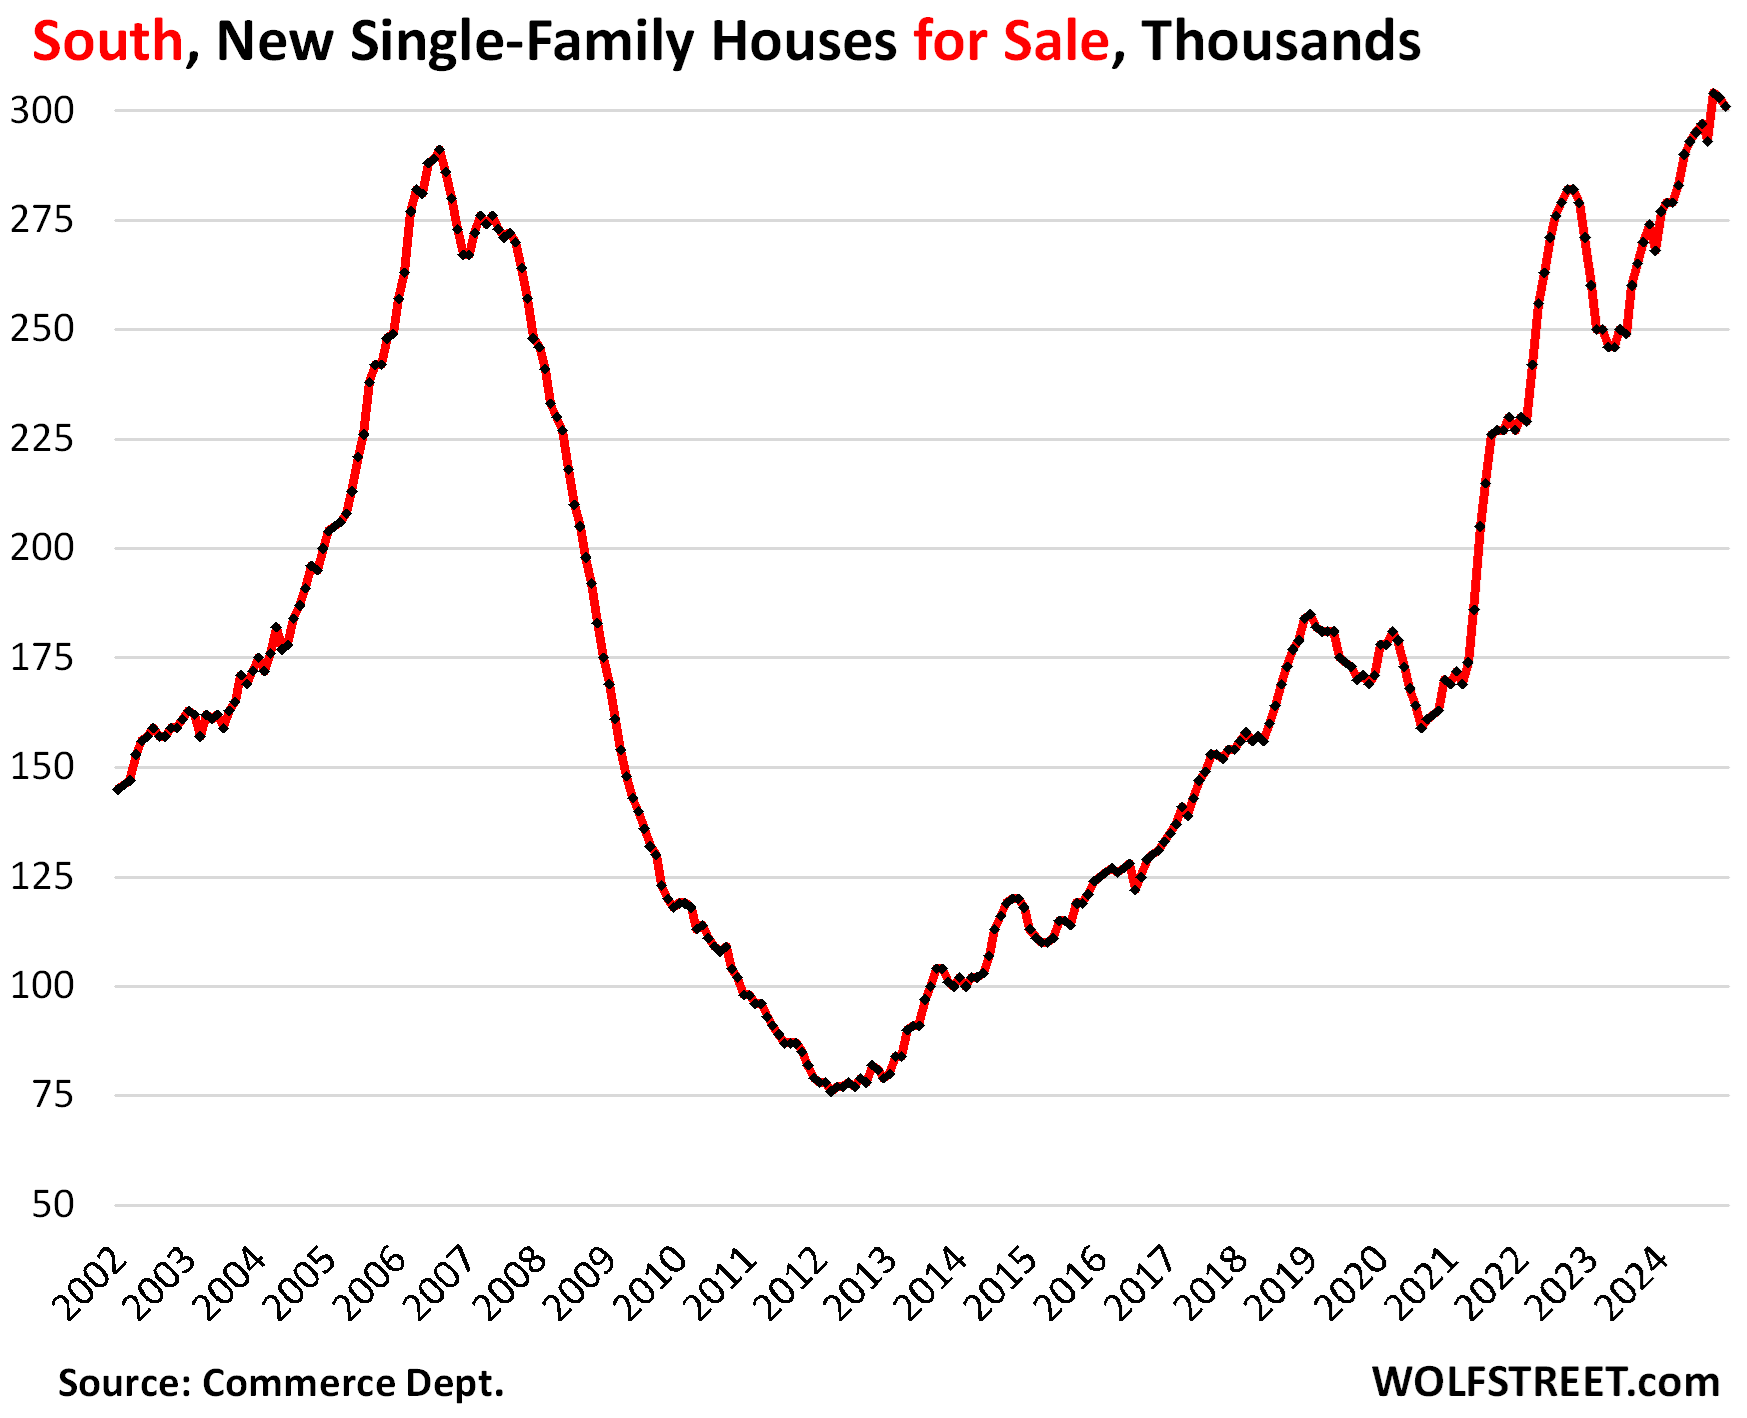
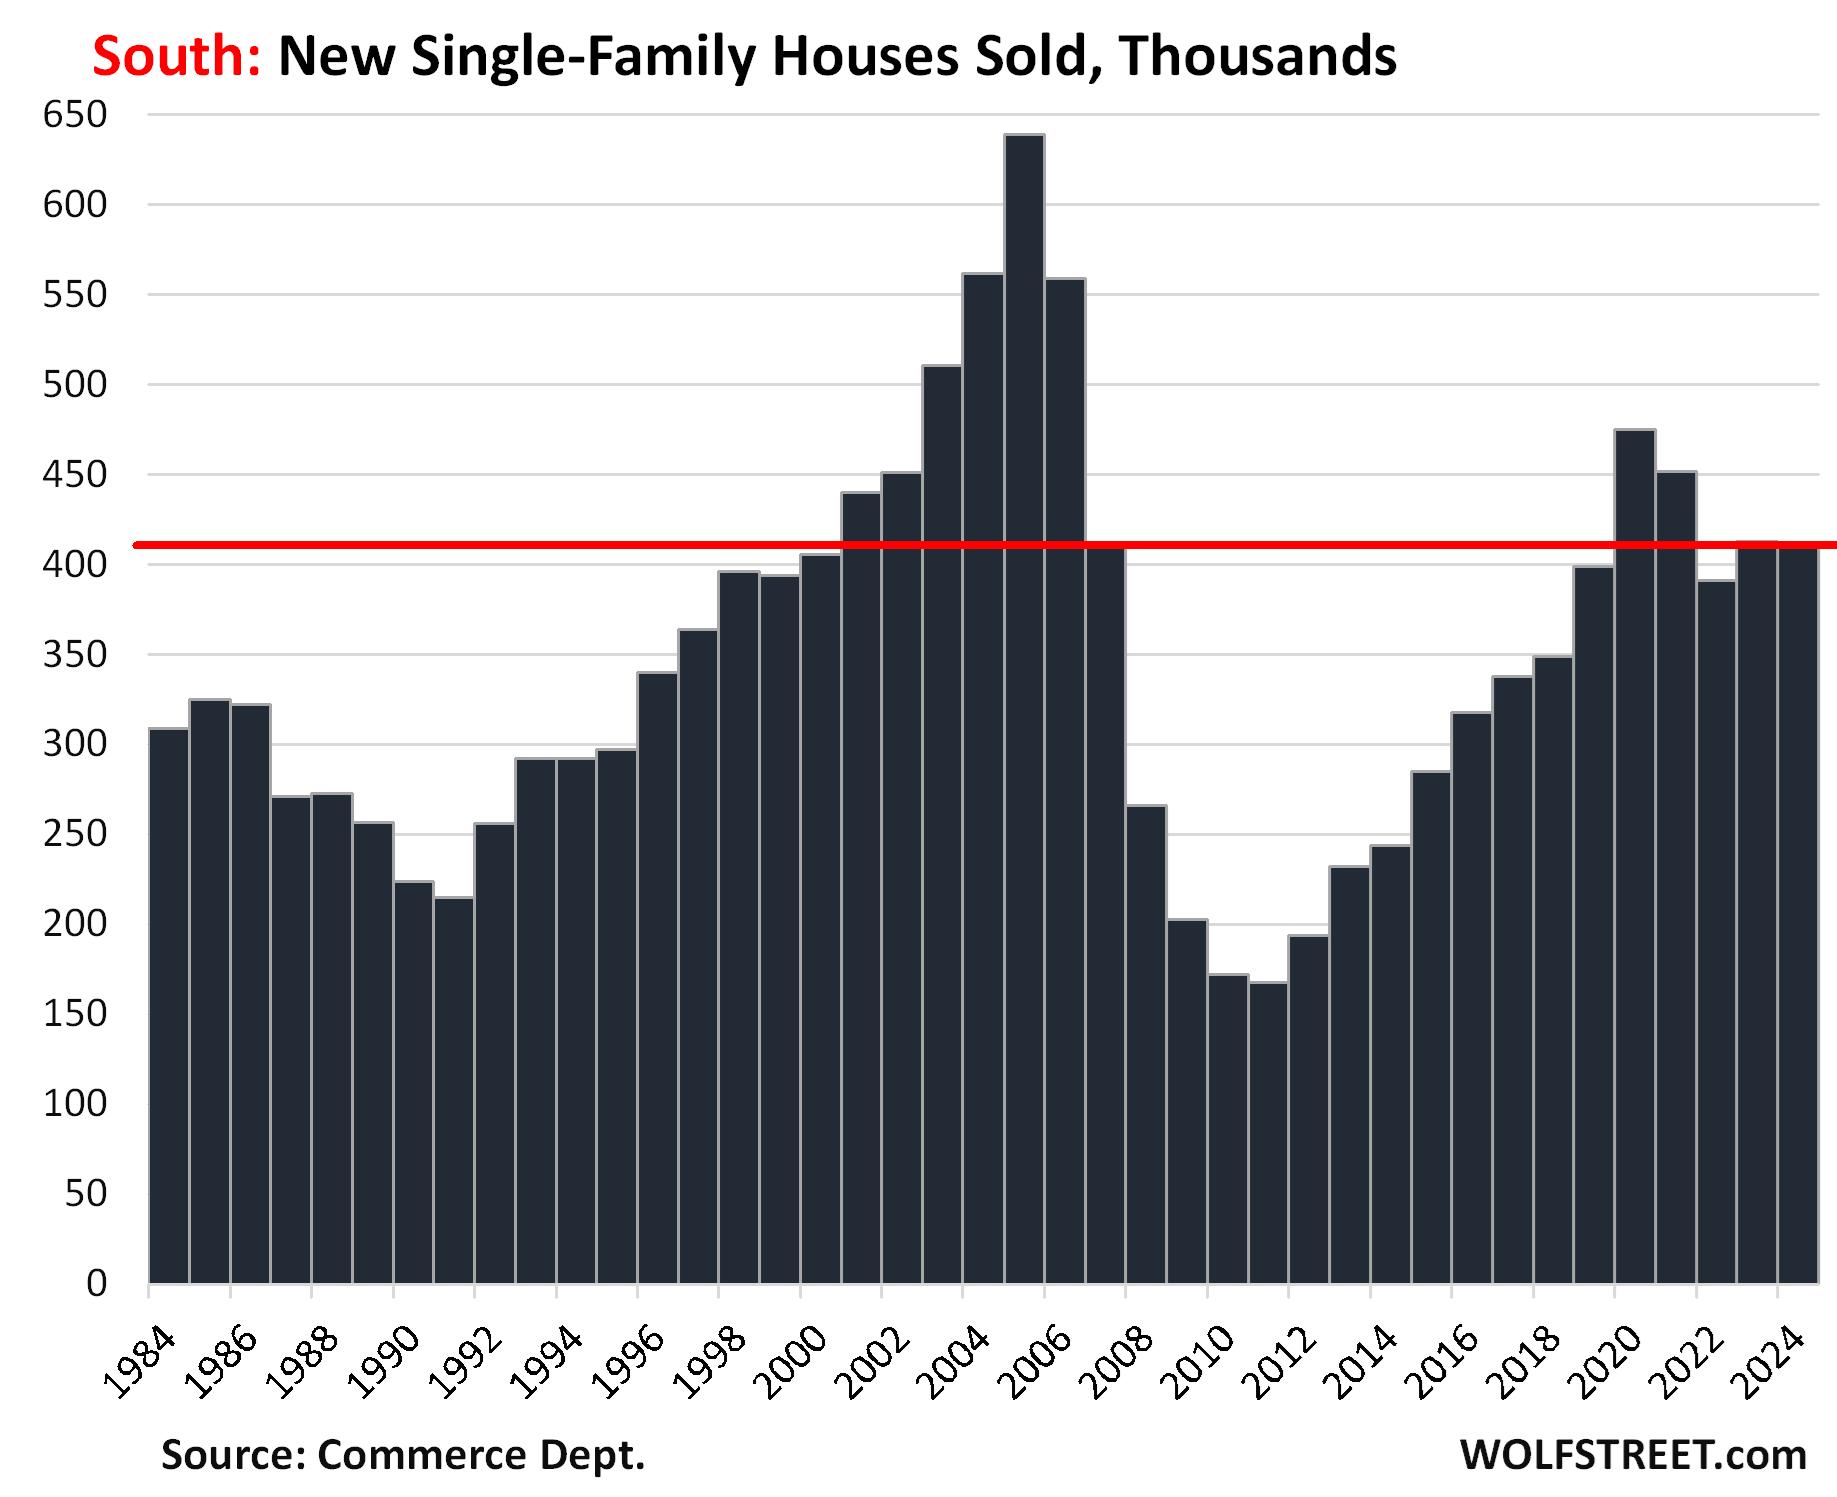
In the South – the largest region, with a population of 133 million, see map below – has the most inventory of new houses ever, surpassing even the astronomical levels on the eve of the Housing Bust, just before it all fell apart.
Since June 2024, new houses for sale in the South have surpassed the high of August 2006. In June, there were 293,000 new houses for sale (compared to 291,000 in August 2006). Since then, the inventory of new houses for sale has further ballooned and in October reached 304,000, and has remained in that range through December (301,000). Since December 2019, inventory has exploded by 76%. This is a massive amount of inventory of new houses for sale.
But sales of new houses in the South in 2024 edged down a hair from the prior year, to 411,000 houses sold, and was down by 13% from 2020 and by 9% from 2021, but was up by 3% from 2019.
Those sales were reasonably decent, thanks to the large-scale incentives, including mortgage-rate buydowns that homebuilders have been using to stimulate demand.
So it’s not that sales have collapsed like sales of existing homes – they haven’t – but that sales lagged far behind the speed with which homebuilders put inventory on the market over the past several years, and now there’s this glut of houses for sale.
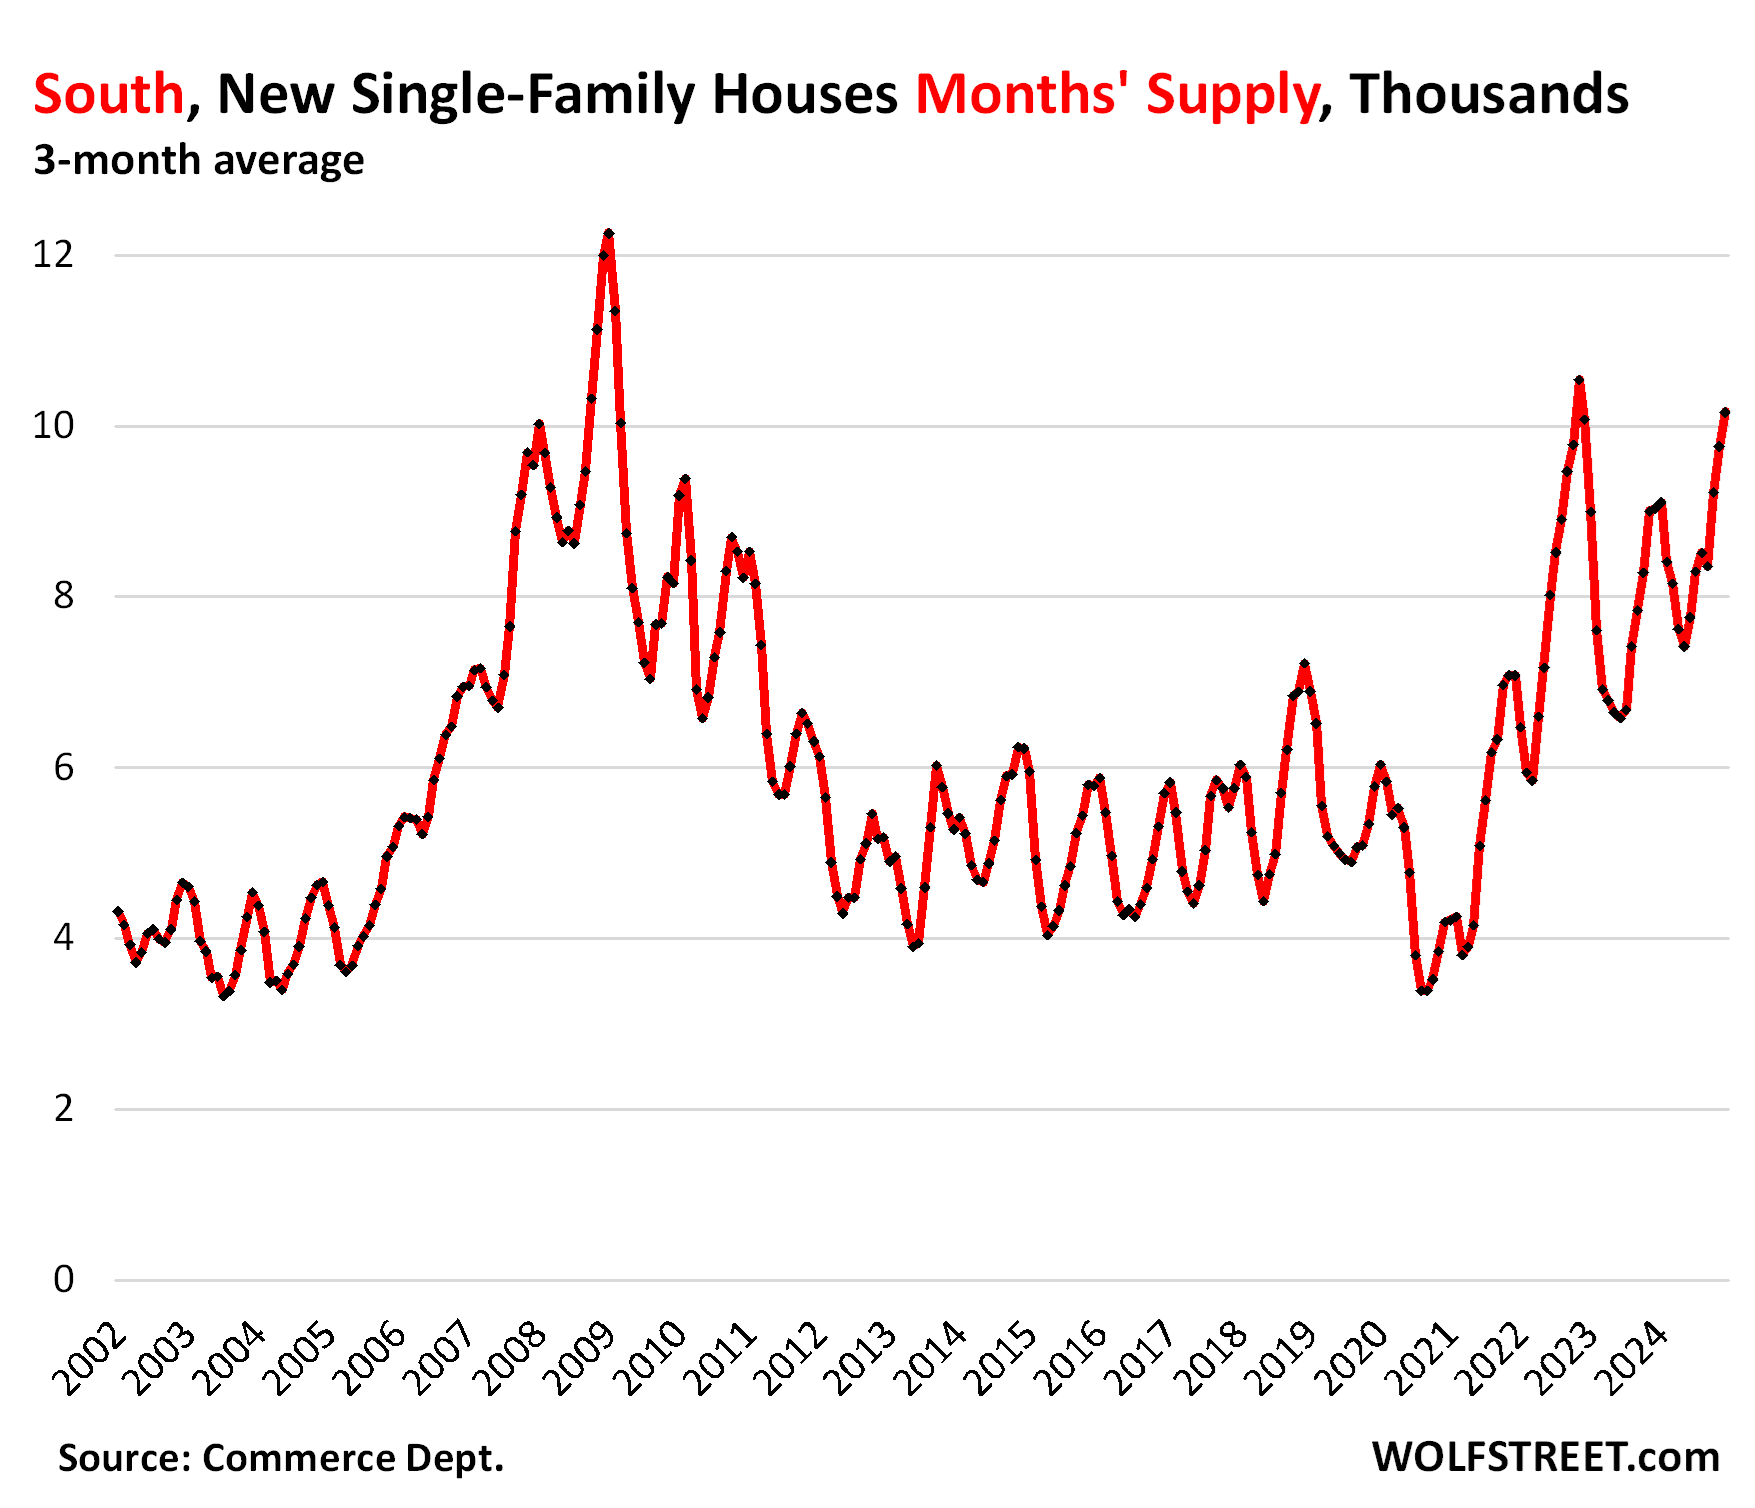
So supply of new houses for sale, at the current rate of sales, has pierced the 10-month range. To iron out some of the big monthly squiggles, we look at the three-month average. Seasonally, the peak supply period is in November through January in this three-month average. Beyond seasonality, the trend is clear, with supply having about doubled from the pre-pandemic range:
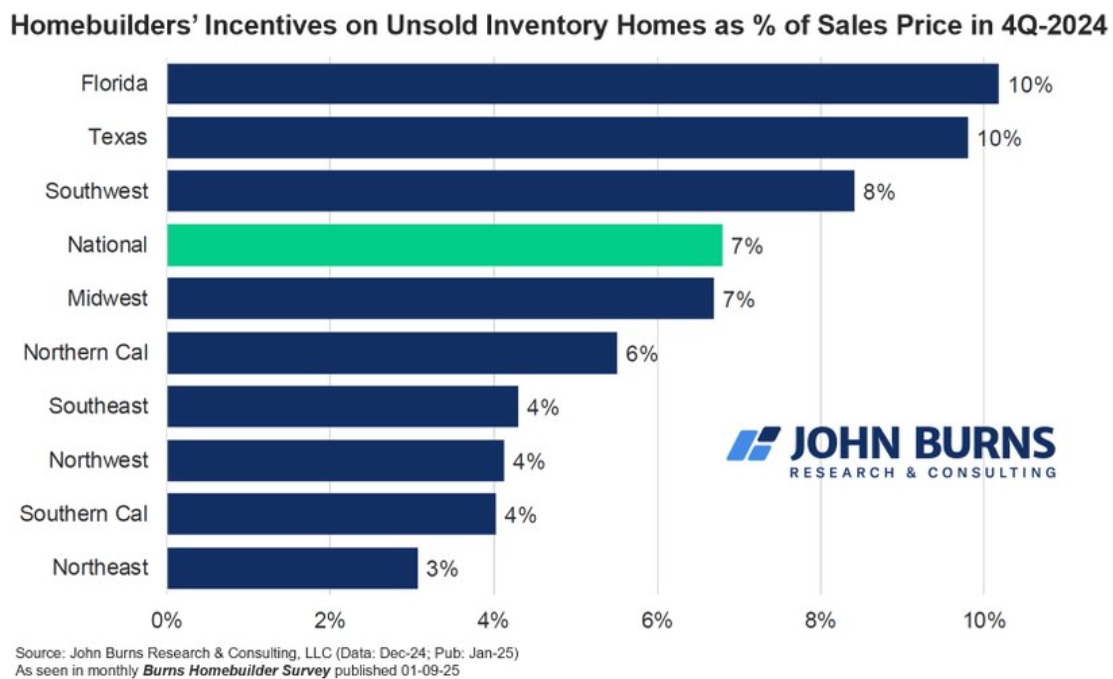
Homebuilders offered incentives amounting to 10% of the sales price on average in Texas and Florida to get the inventory moving, according to the most recent Burns Homebuilder Survey. And that’s clearly not enough to get the inventory moving.
Here is a map of the four Census regions:

The West.
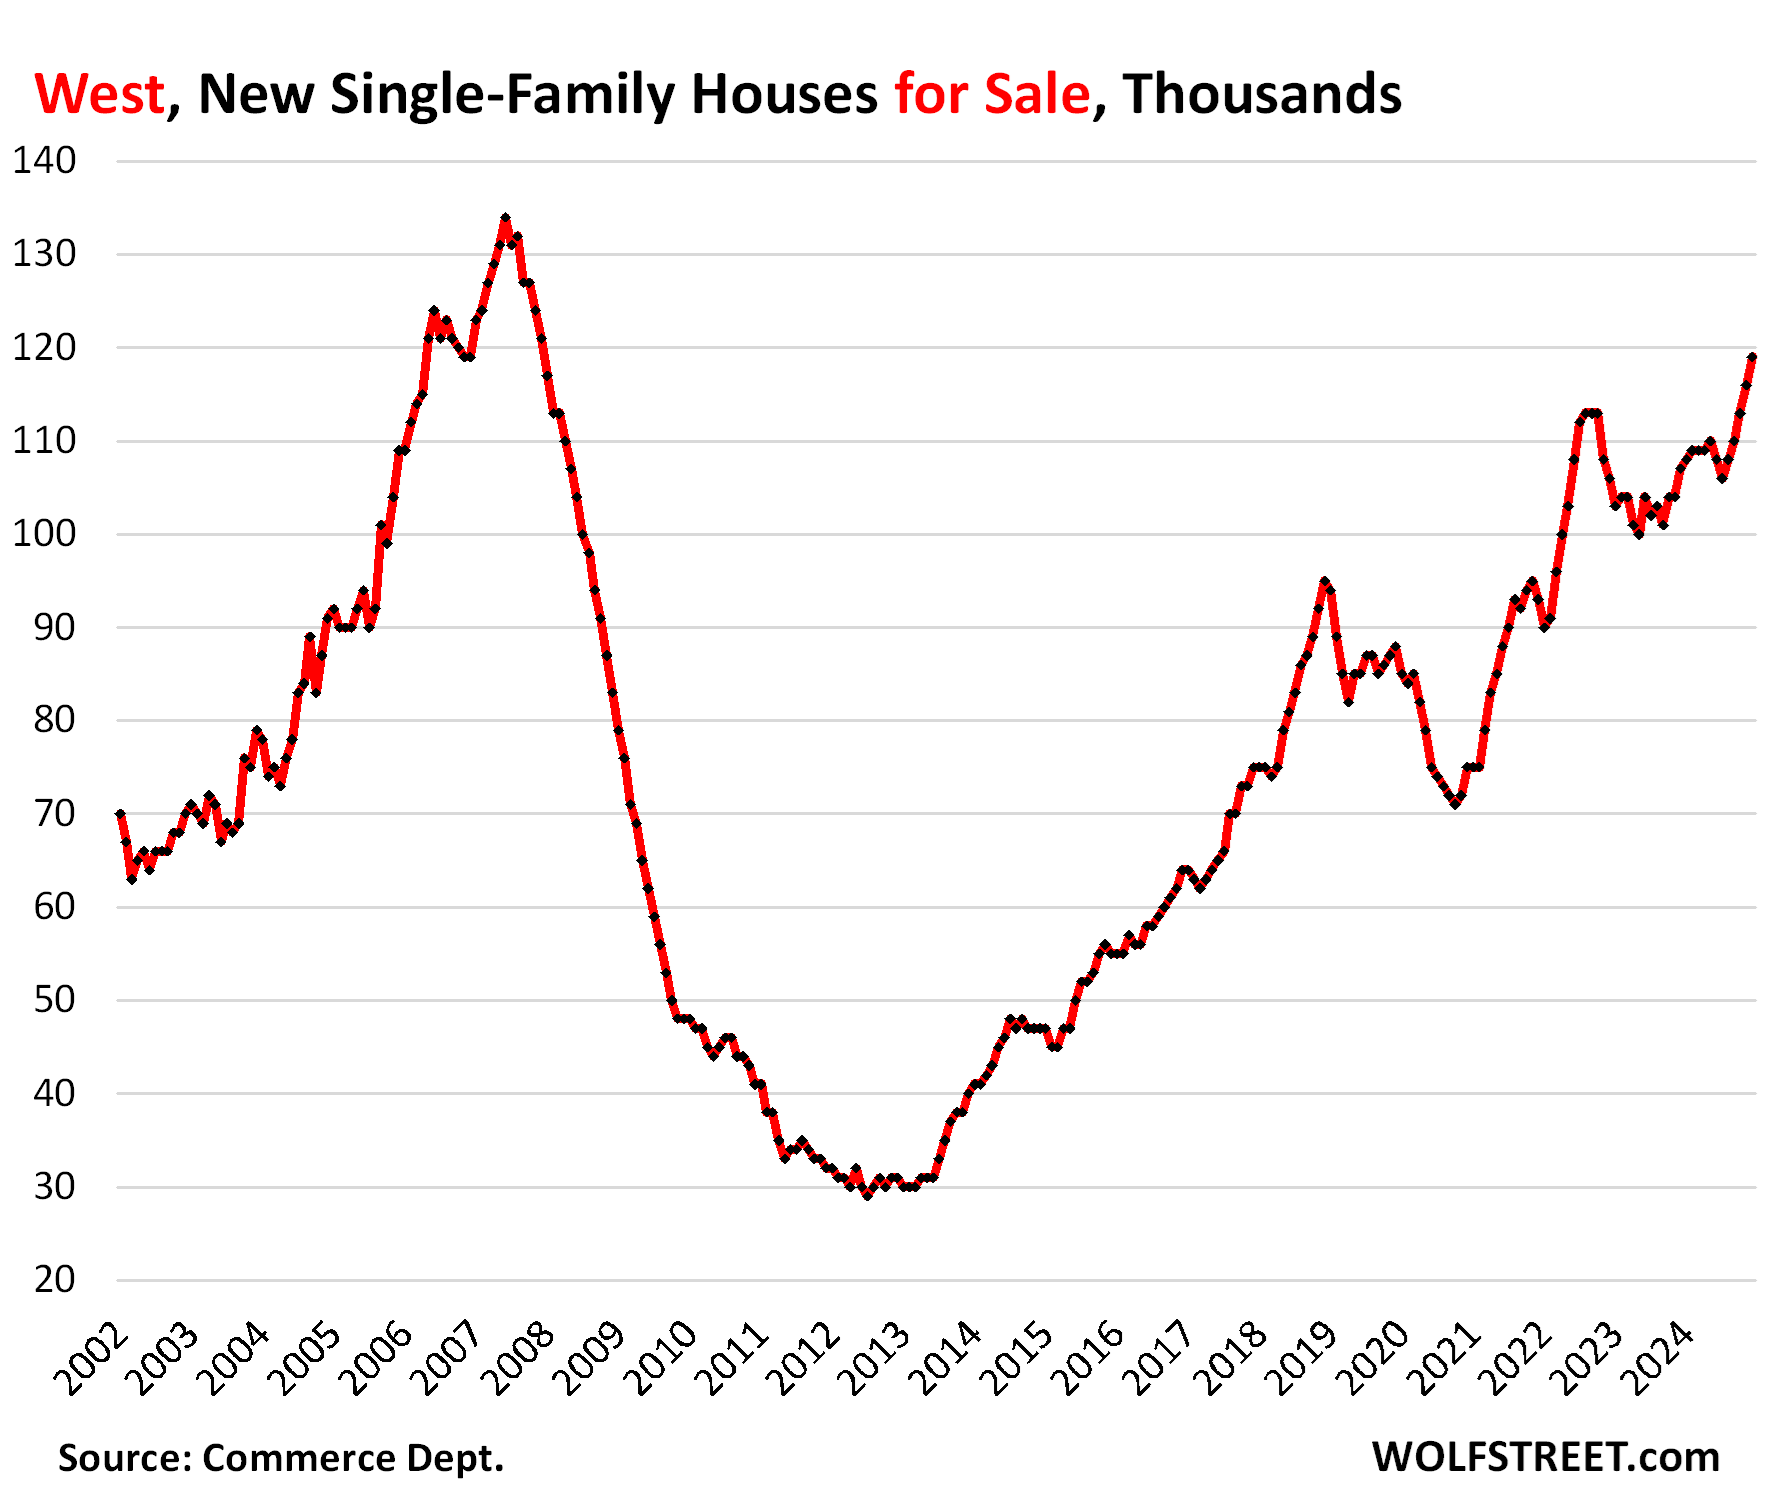
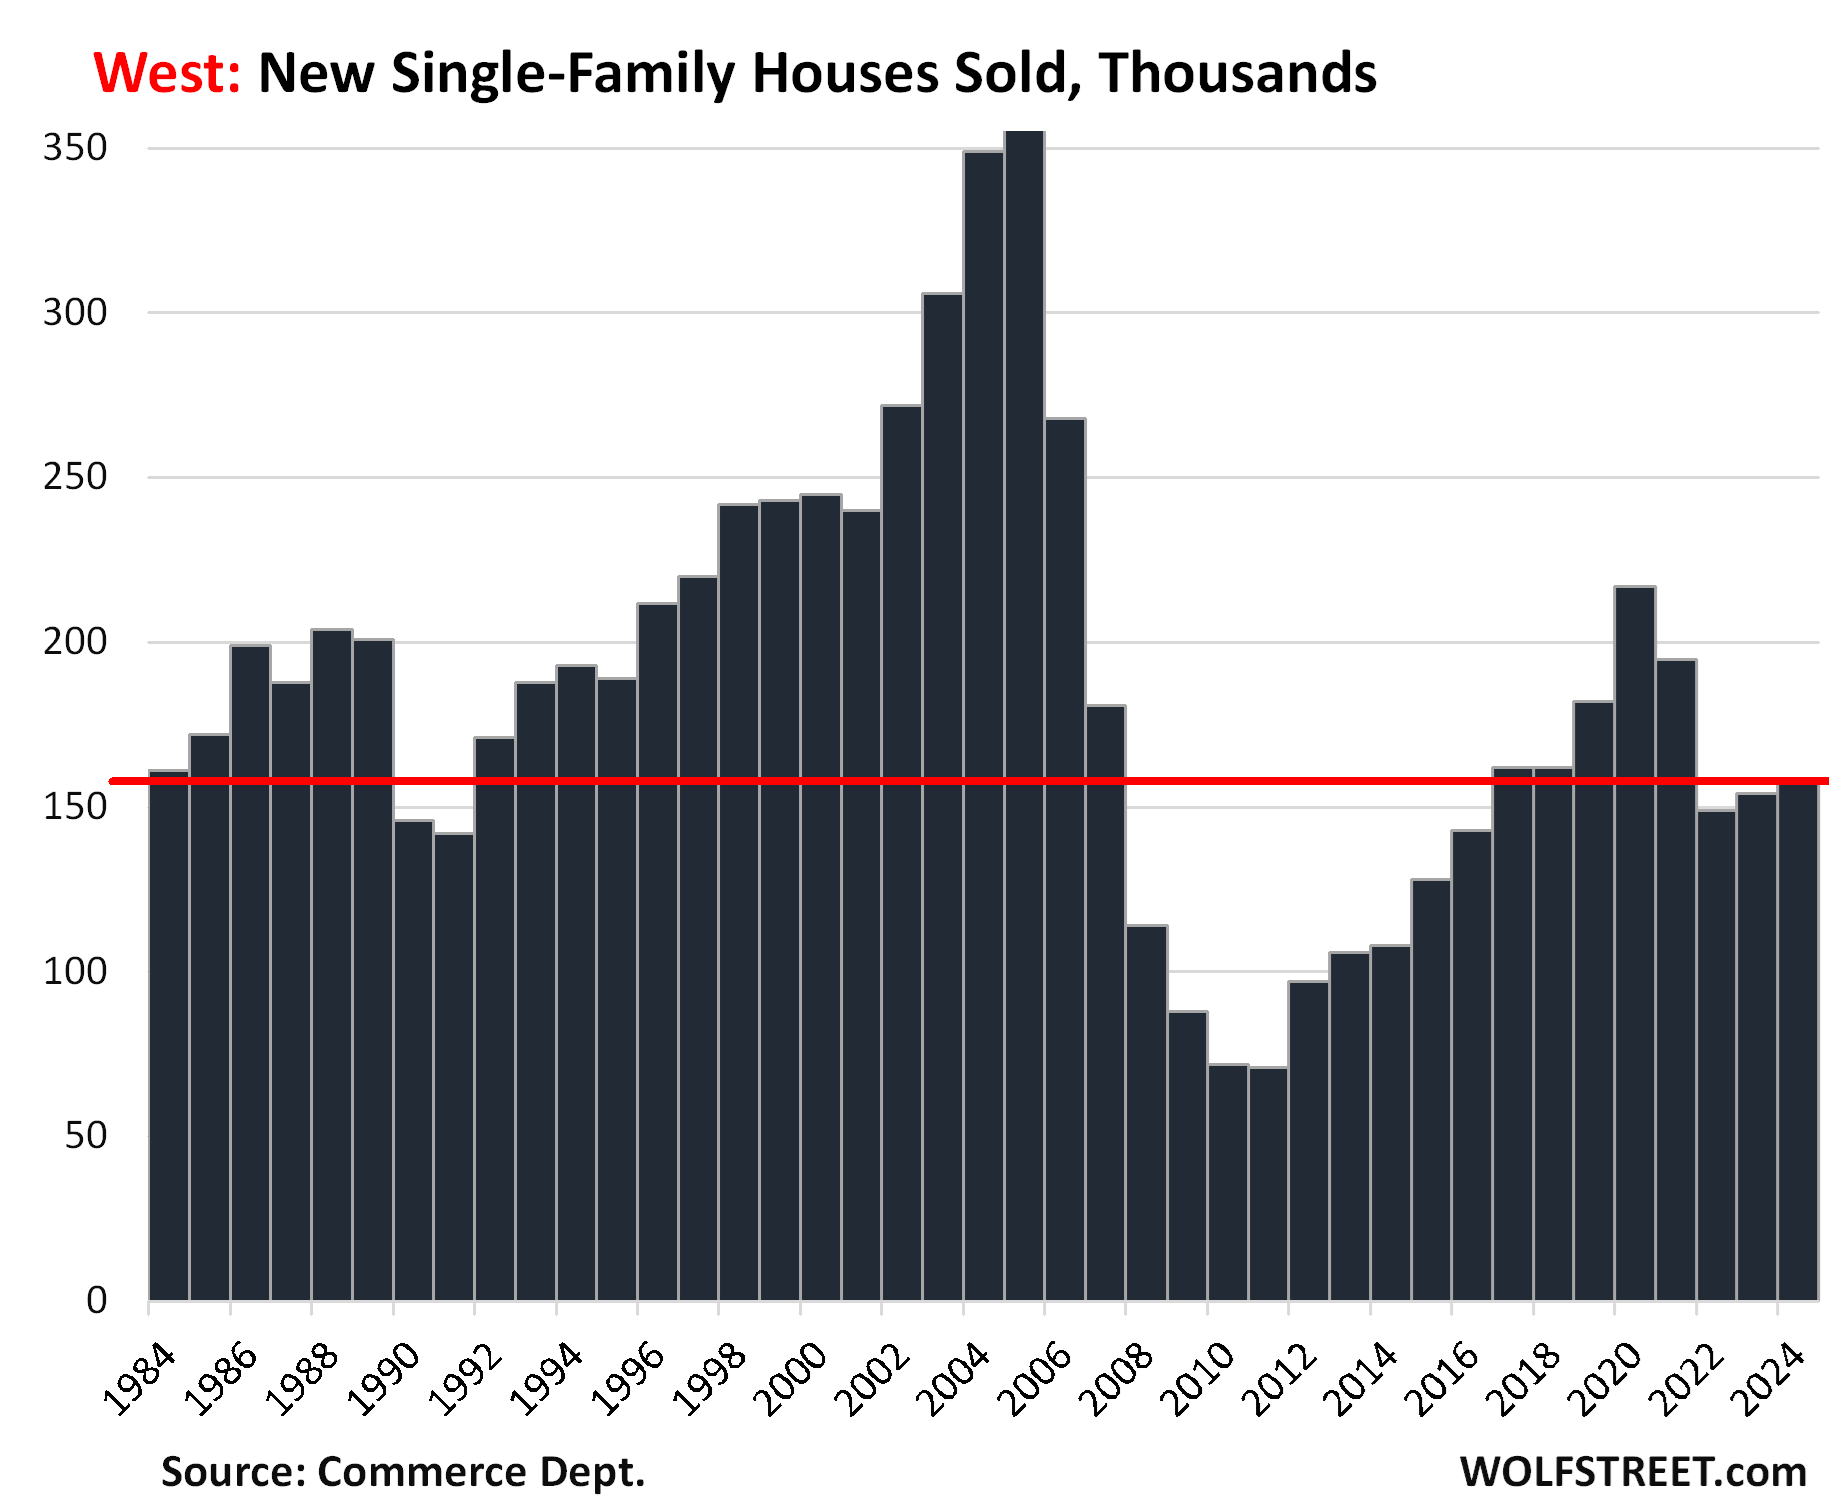
In the West – the second largest Census region, with a population of 80 million – a similar problem is piling up. Inventory of new houses for sale surged to 119,000, the highest inventory since December 2007, not far below the peak in June 2007 early on in the Housing Bust, and up by 35% from 2019:
But sales have been anemic in the West because prices are way too high. In 2024, a total of 157,000 new houses were sold, down by 28% from 2020, and down by 14% from 2019. While annual sales were up from the prior two years, all three years were at the lower end of the scale, with only 2008-2016 and 1990 and 1991 having been even lower.
So lots of inventory piling up and sluggish sales:
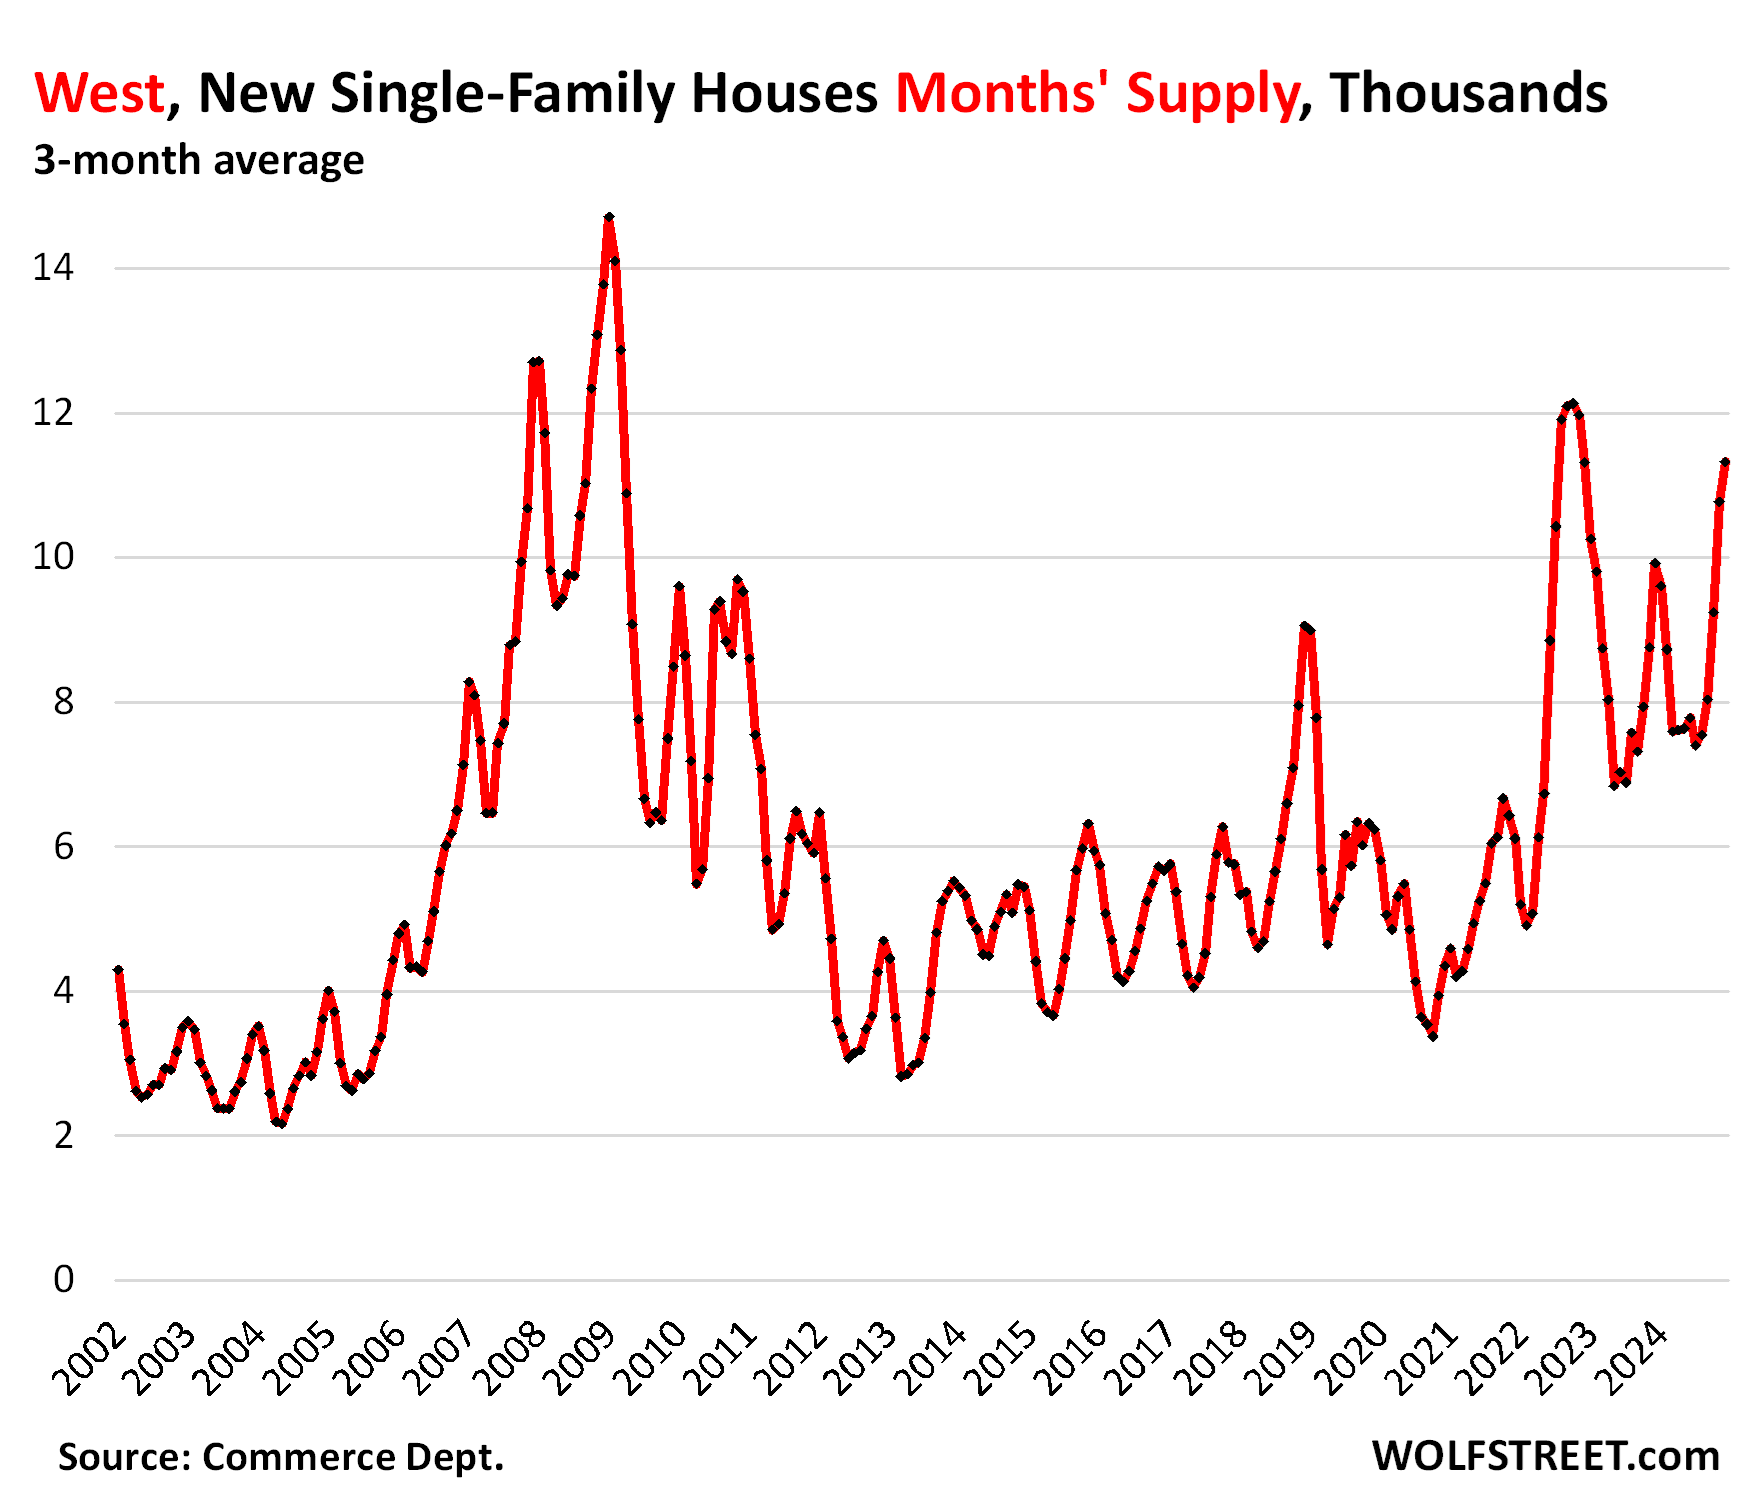
Supply has therefore spiked to 11.3 months on a three-month-average basis. There were only three brief periods with higher supply:
- In late 2022 as the market for new houses was waylaid by the surge in mortgage rates, triggering a tsunami of cancellations of new-house purchases, as buyers who’s sighed the contract when rates were 3% or 4% couldn’t take delivery when rates were 6%.
- Four months of November 2008 to February 2009.
- Two months of December 2007 and January 2008.
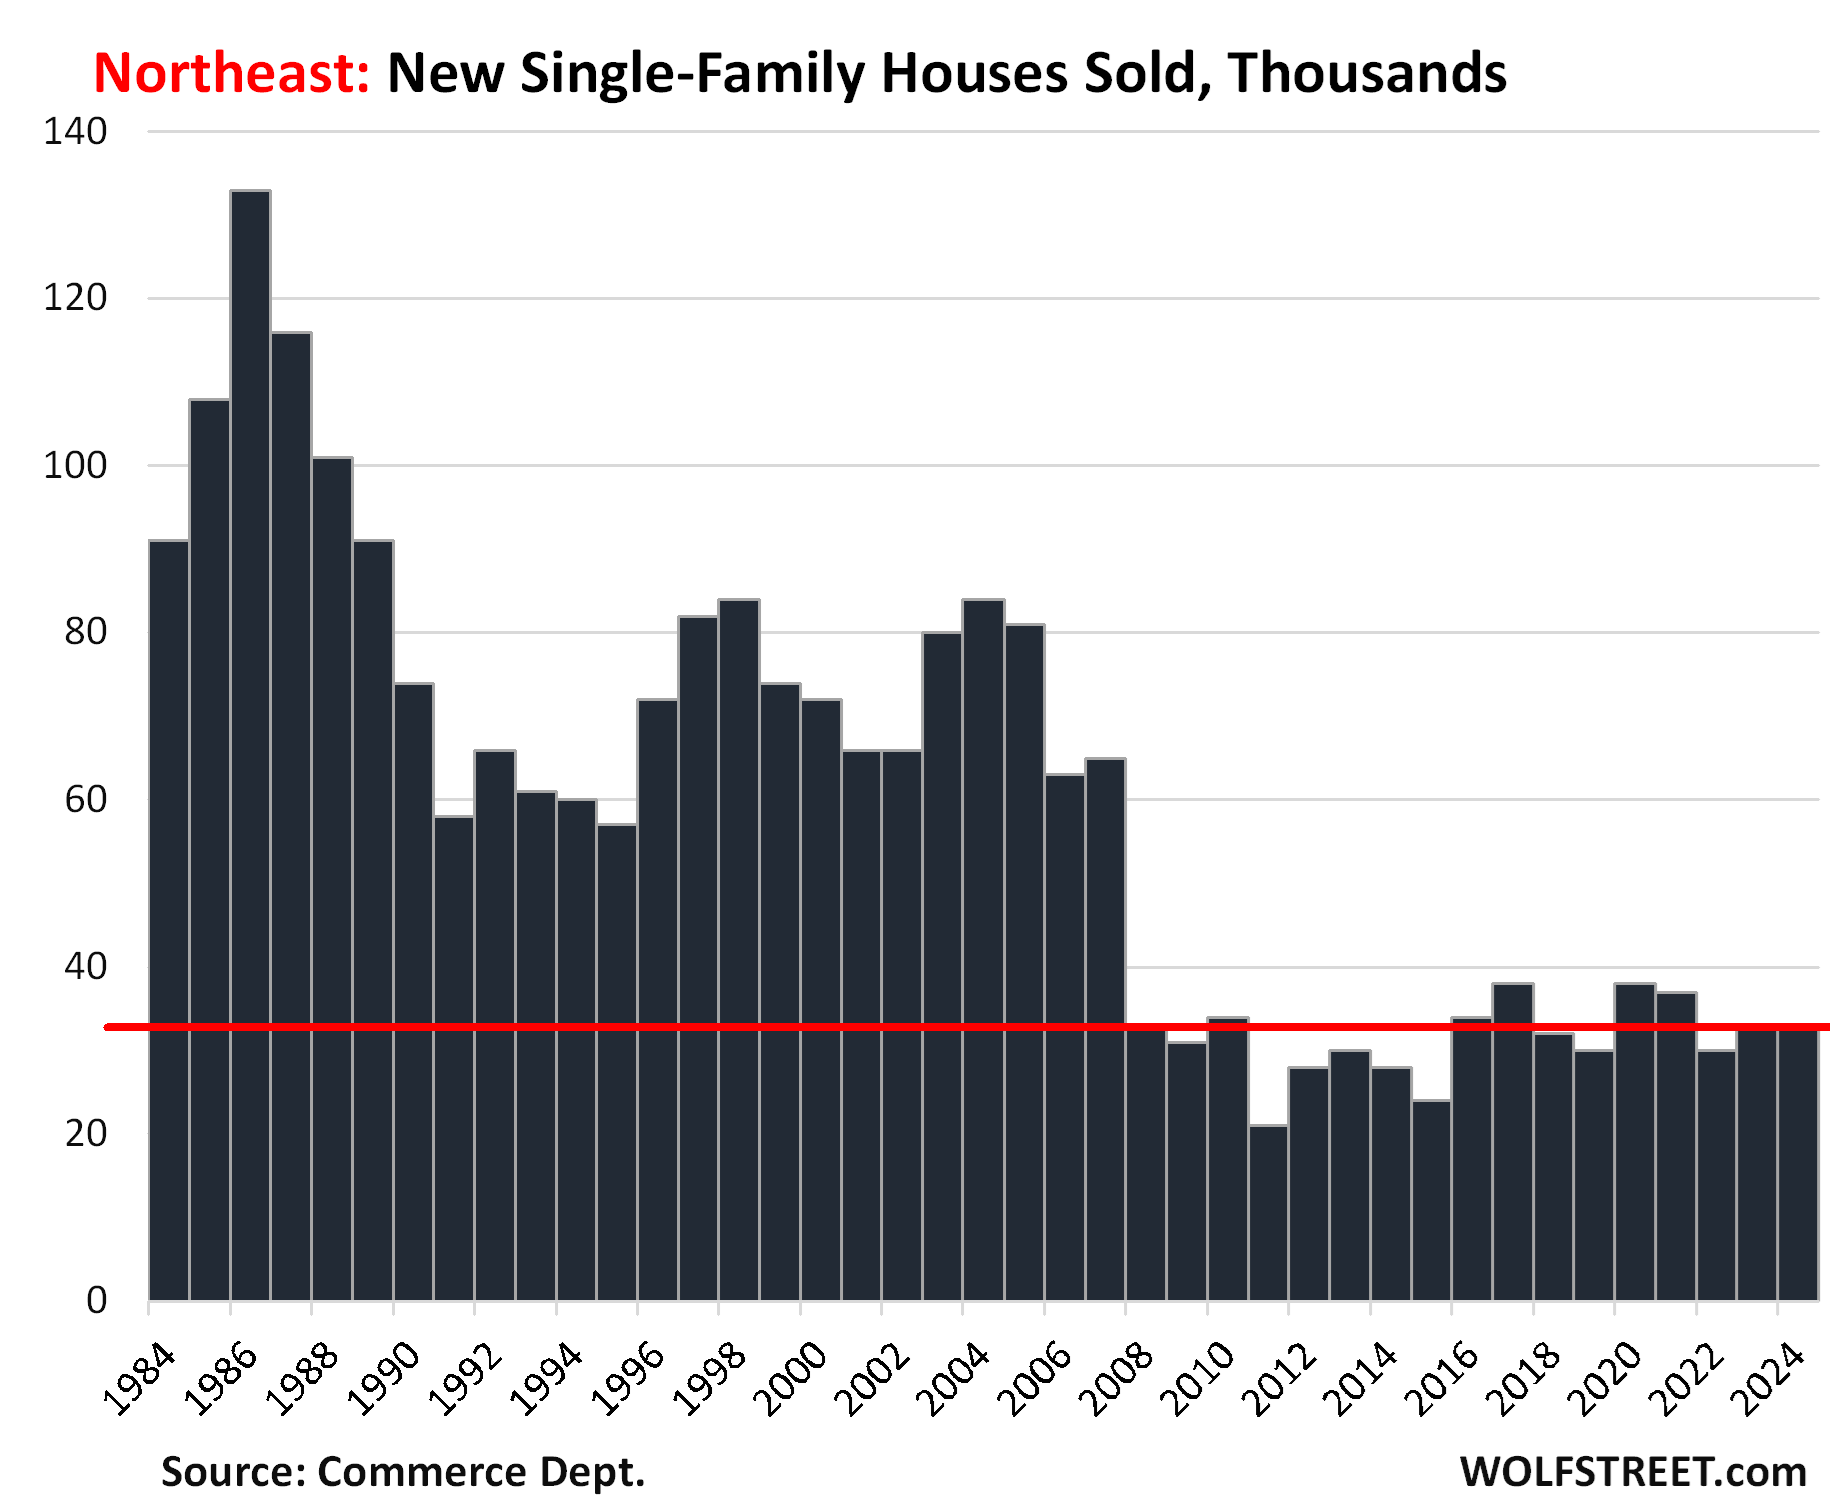
The other two regions are not big players in the single-family market
The Northeast and Midwest are smaller in terms of the population, and much much smaller in terms of the market for new single-family houses. The regions are dominated by huge old cities, particularly the Northeast with New York City, Boston, Philadelphia, and the cities and urban areas around them. New construction is focused on multifamily to increase density and shorten commutes from the already unwieldy urban sprawl.
So there are only a few sales of new houses in those two regions, amid rising inventory and supply. But all of it is too small to really weigh on the national scale.
In the Northeast, only 33,000 new houses were sold in all of 2024, down by about two-thirds since the 1980s, but roughly in the range of the past 10 years.
The Census Bureau rounds sales on a monthly basis to the nearest 1,000 houses. In the Northeast, these rounded sales have been either 2,000 a month or 3,000 a month rounded. And on a few occasions 4,000 a month. We use annual sales here which would largely average out the big rounding errors of the monthly data.
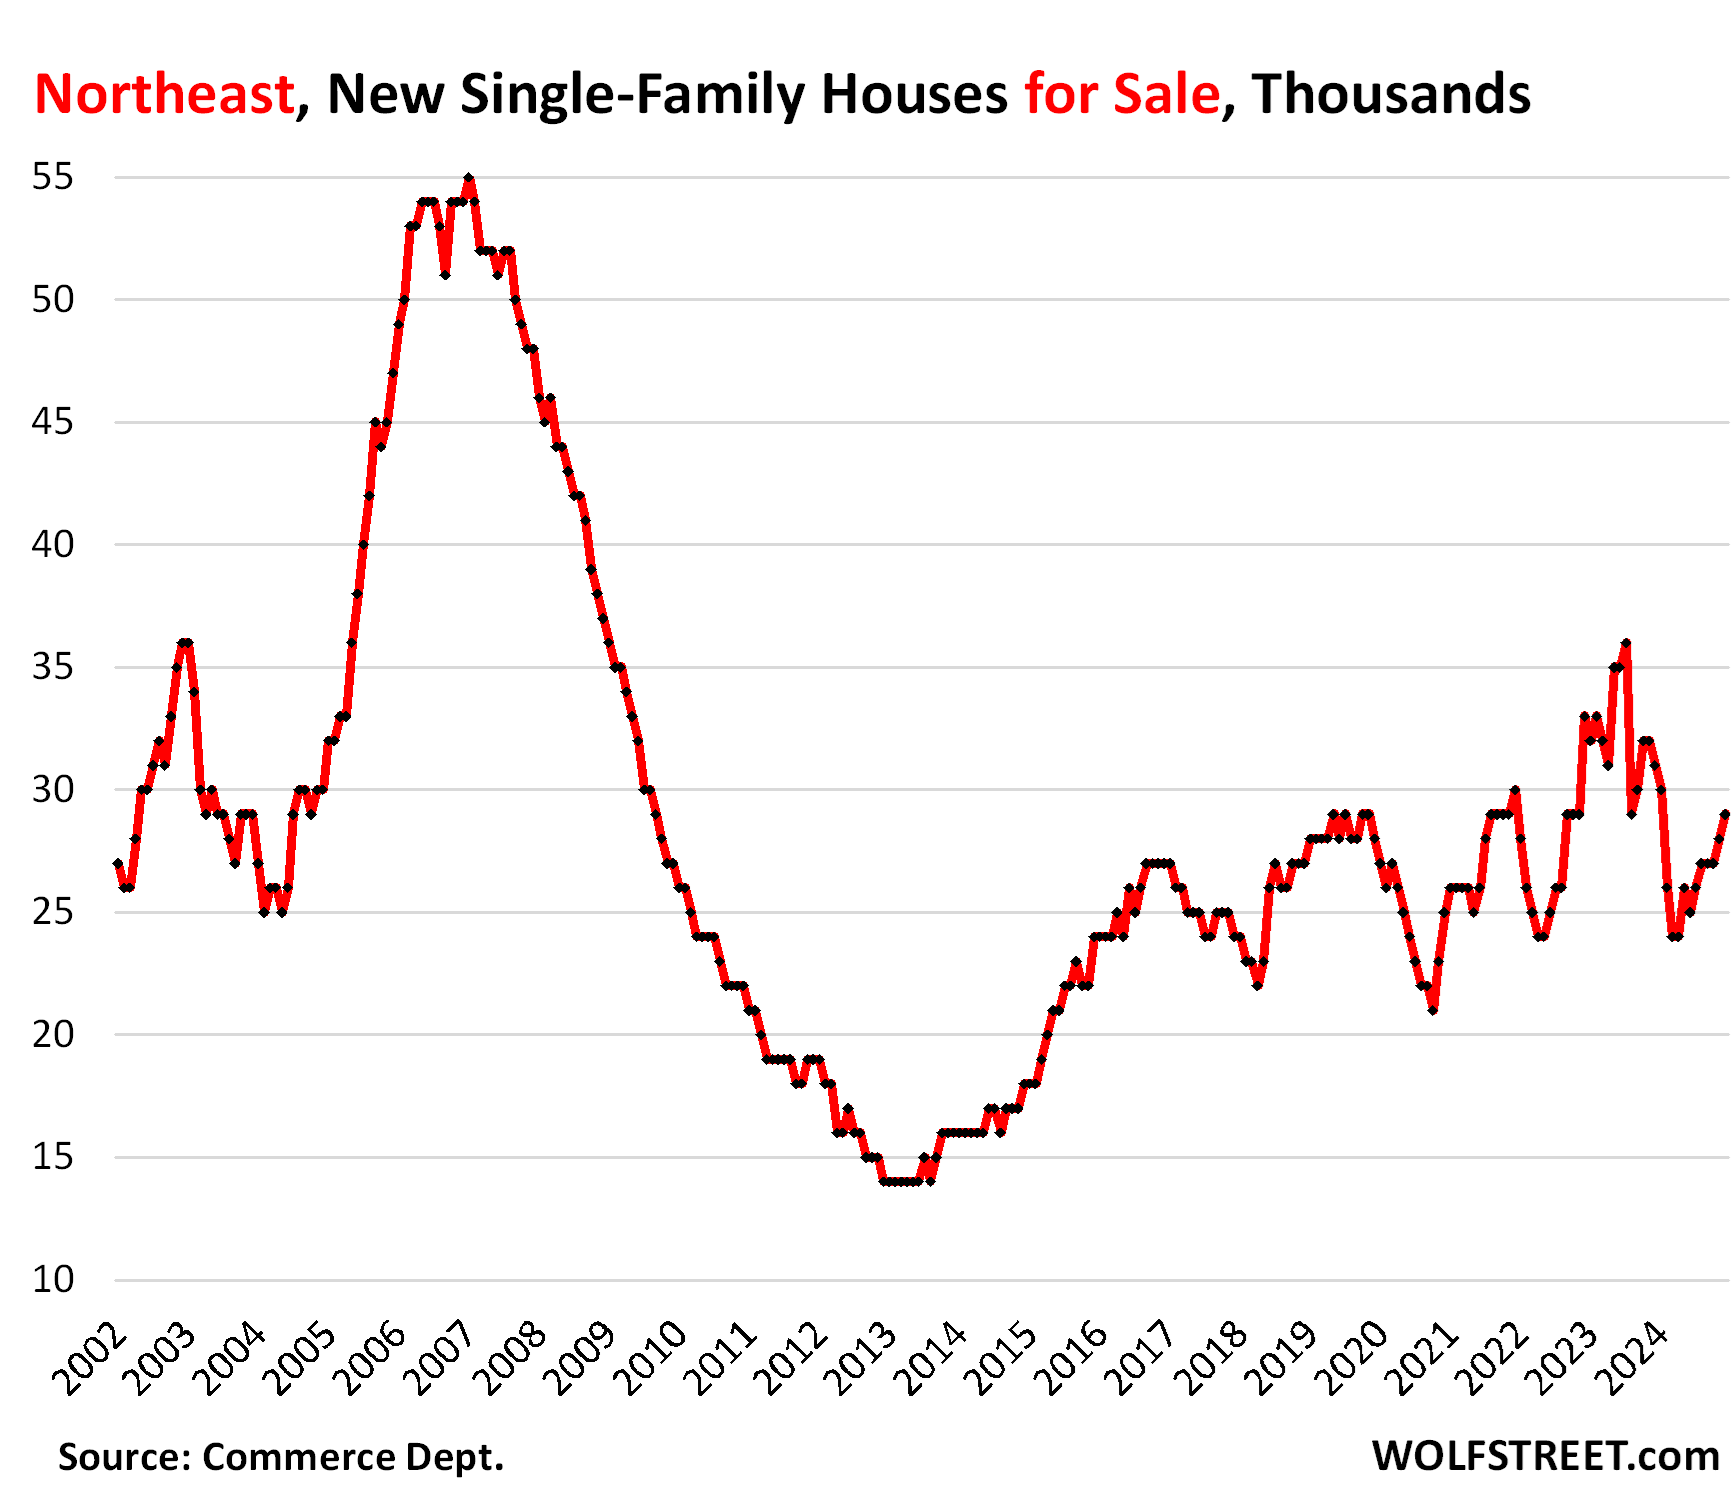
Inventory in the Northeast has been zigzagging higher over the past few years. Supply reached 17 months, by far the highest of any region. During the worst moments during the Housing Bust, supply reached 18 months. This is just not a big market for new single-family houses that would expand the urban sprawl further.
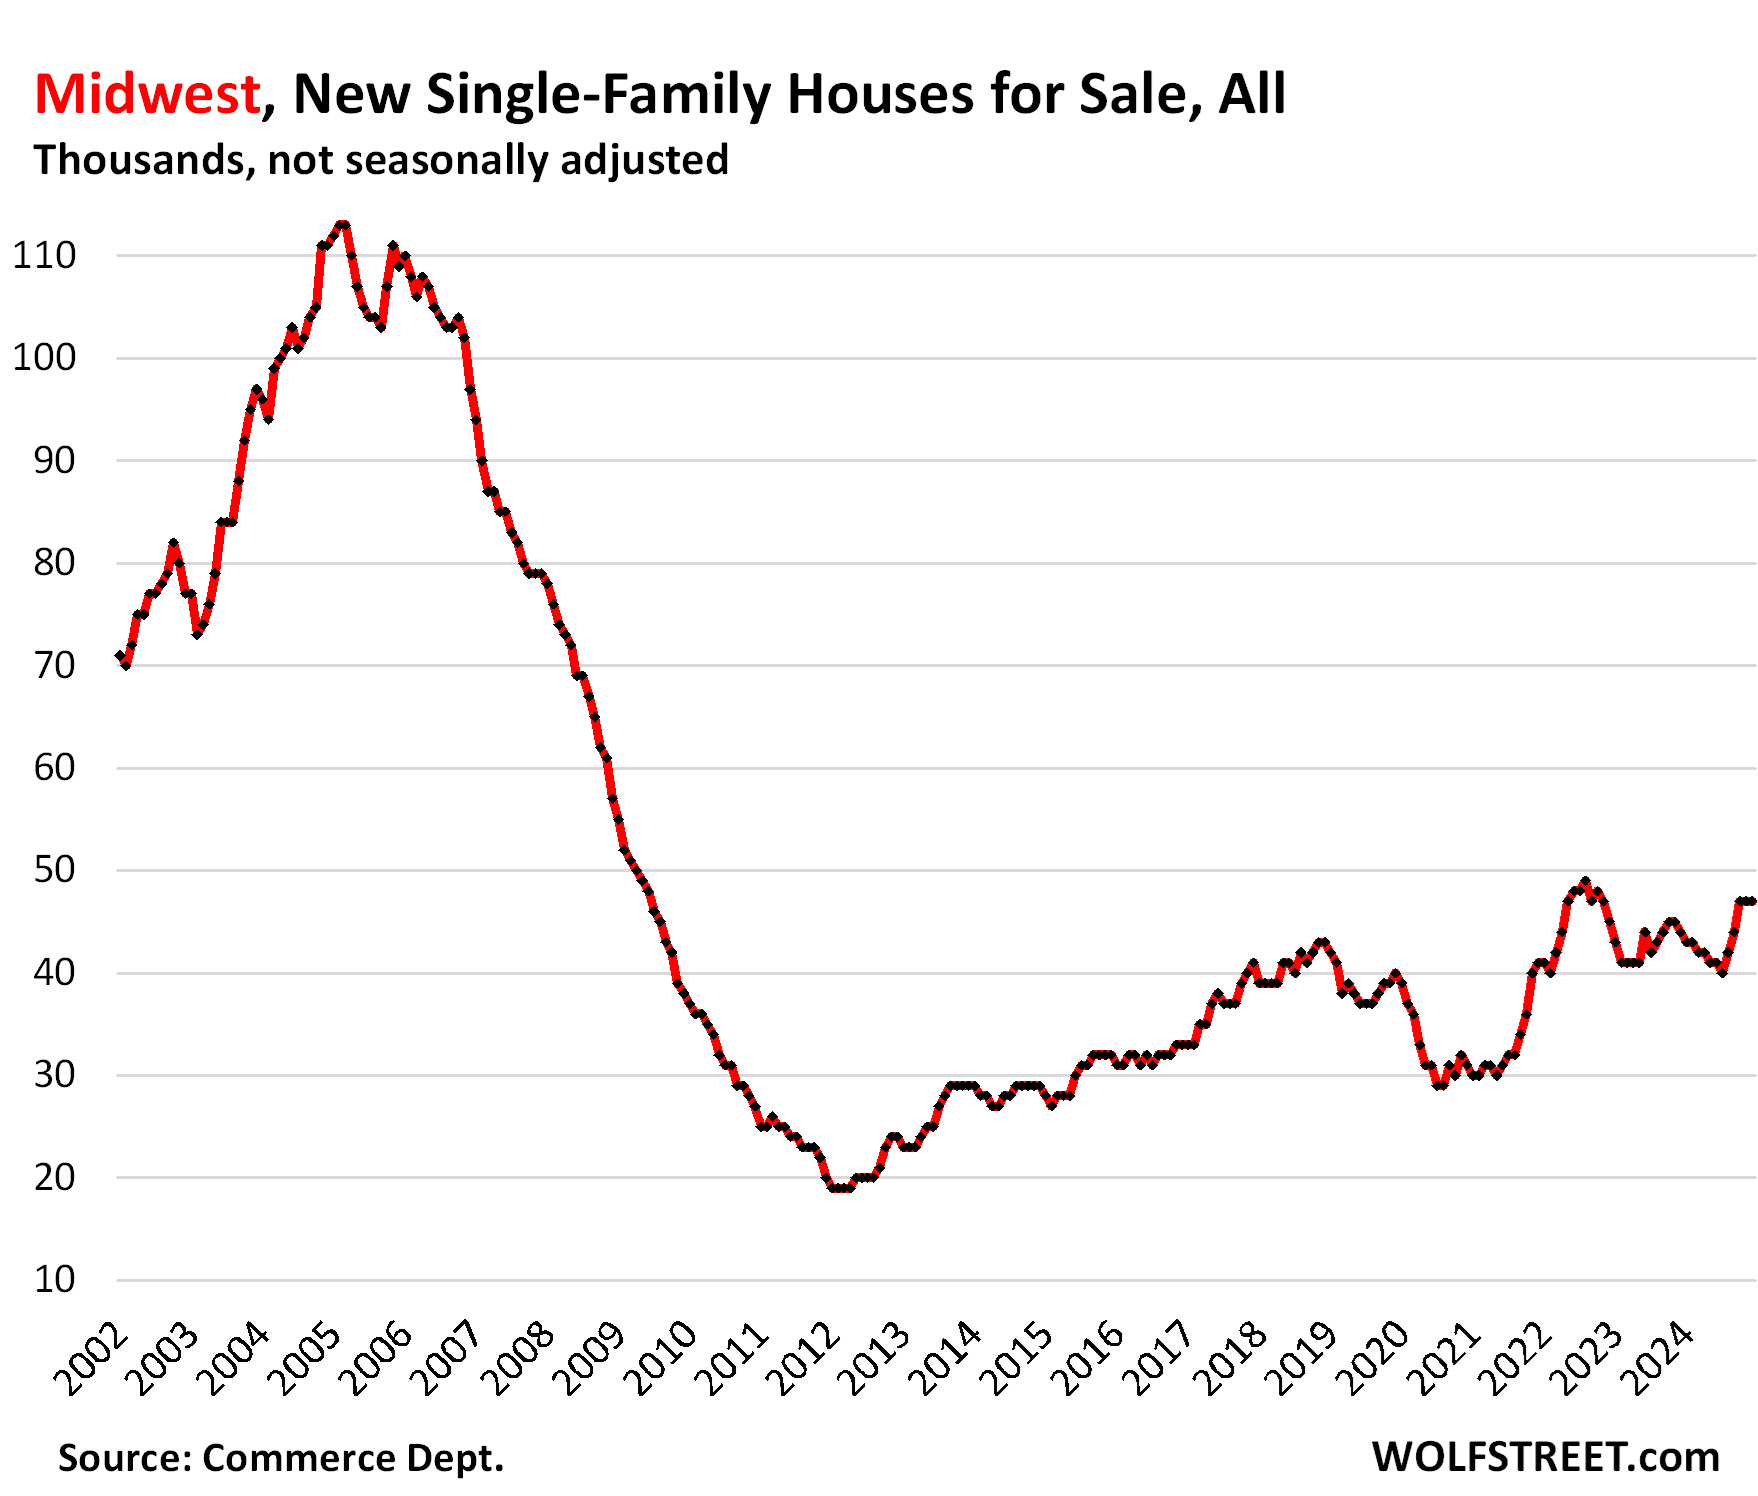
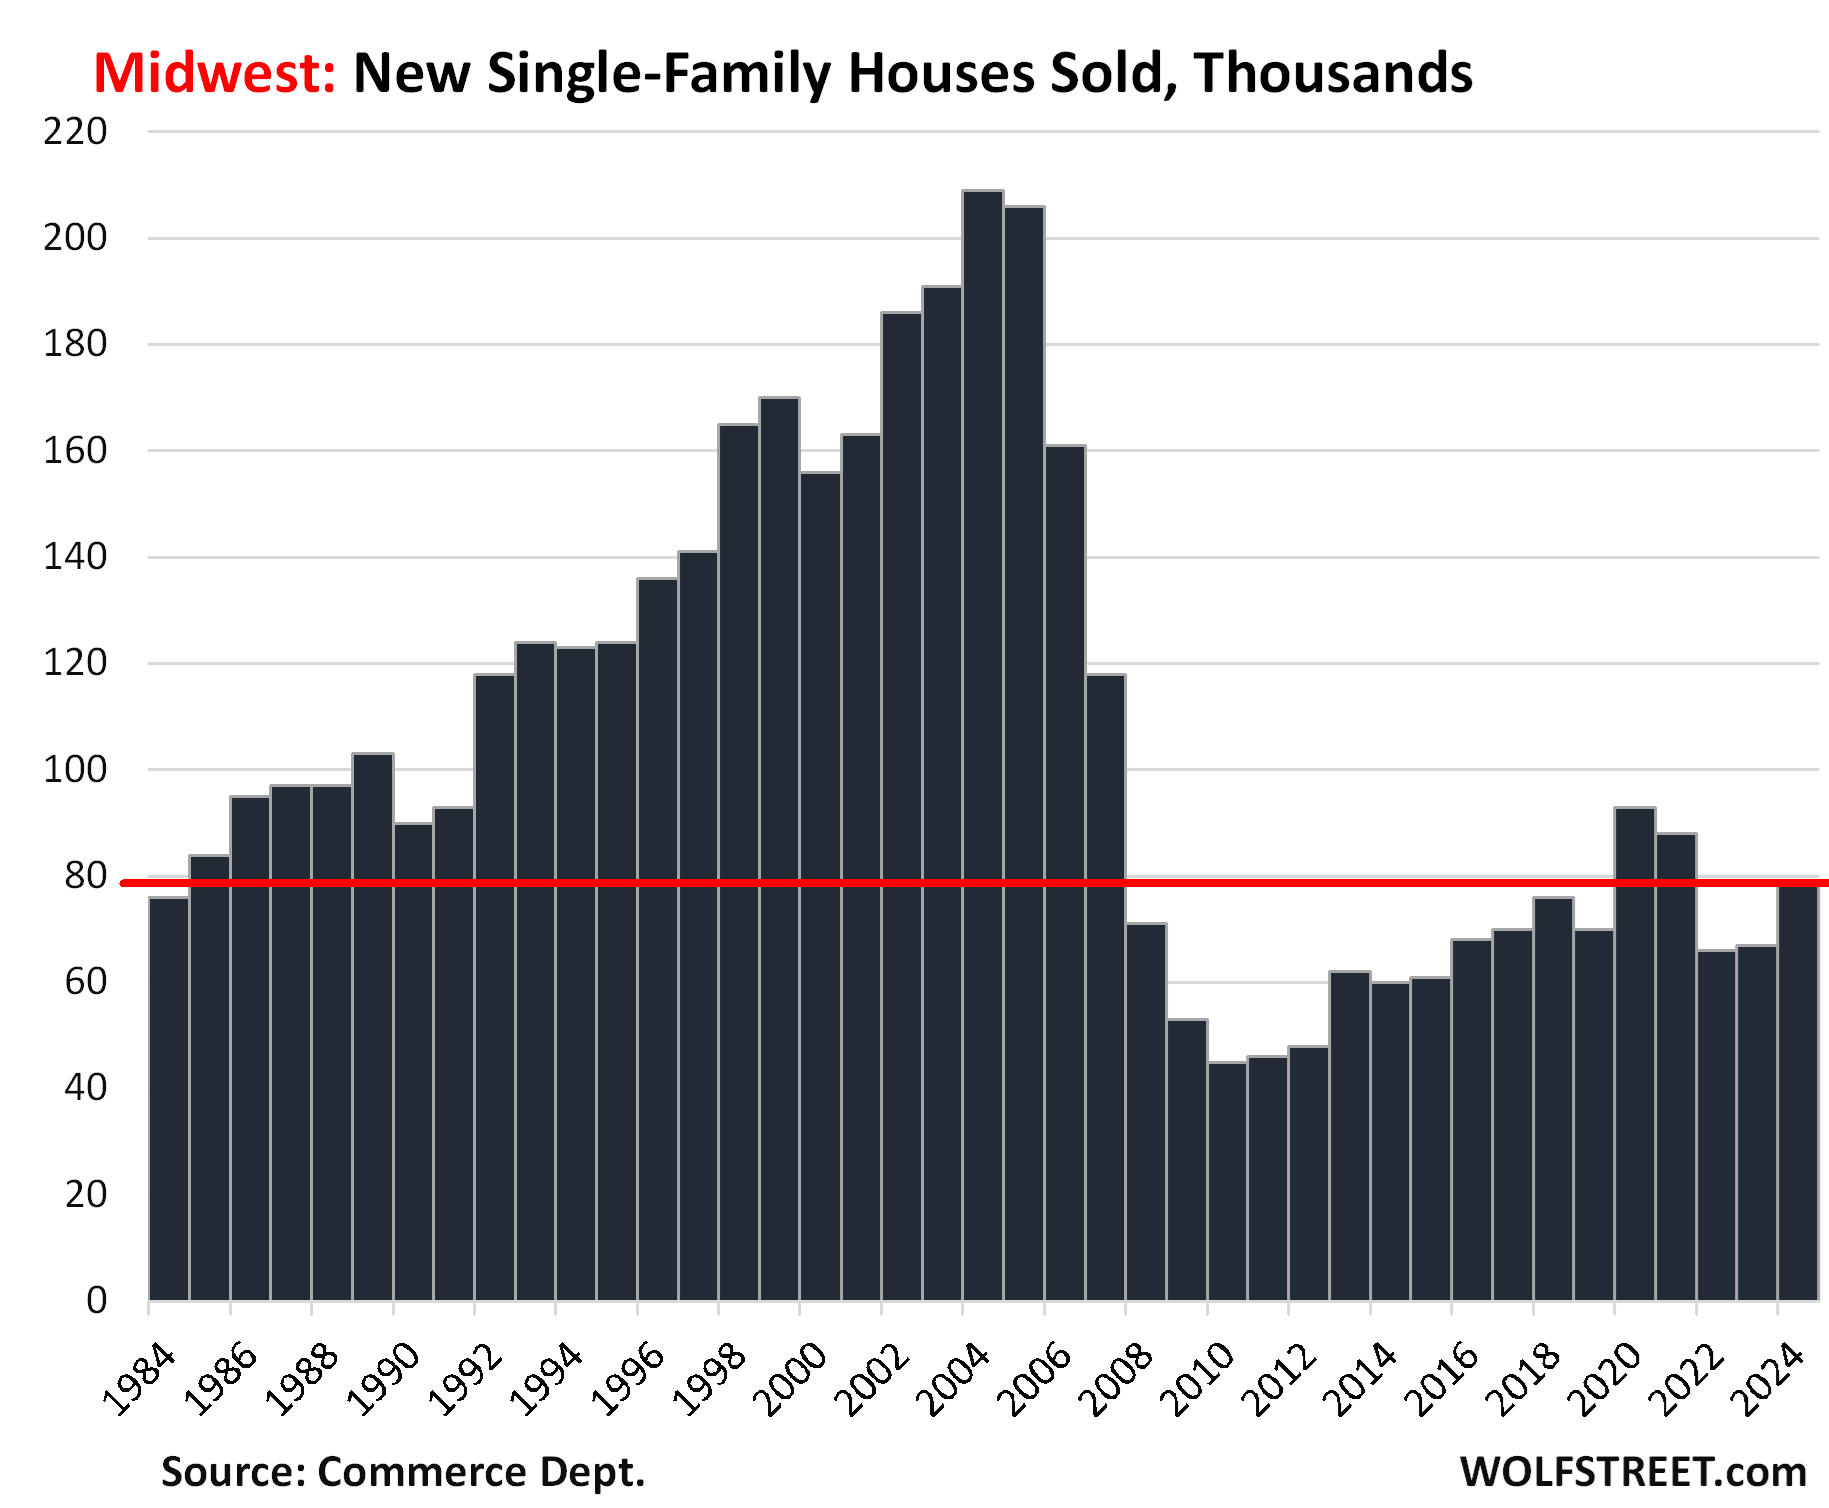
In the Midwest, sales of single-family houses in 2024 rose to 79,000:
Inventory in the Midwest, at 47,000 houses over the past three months, is at the highest level since late 2022, and beyond that at the highest level since 2009. Supply exceeds 9 months on a three-month average basis.